Examples#
Example 01 - Curves from Expression#
 1from hw import *
 2from hw.hg import *
 3import os
 4
 5ses = Session()
 6ses.new()
 7win = ses.get(Window)
 8win.type = "xy"
 9
10exprXlist = ["0:1:0.0001", "c1.x"]
11exprYlist = ["sin(x*2*PI)", "c1.y+0.2*sin(60*x*2*PI)"]
12labelList = ["Basic Oscillation 1 HZ", "Overtone 60 HZ"]
13
14for exprX, exprY, label in zip(exprXlist, exprYlist, labelList):
15    cu = CurveXY(
16        xSource="math",
17        xExpression=exprX,
18        ySource="math",
19        yExpression=exprY,
20        label=label,
21    )
22
23win.update()
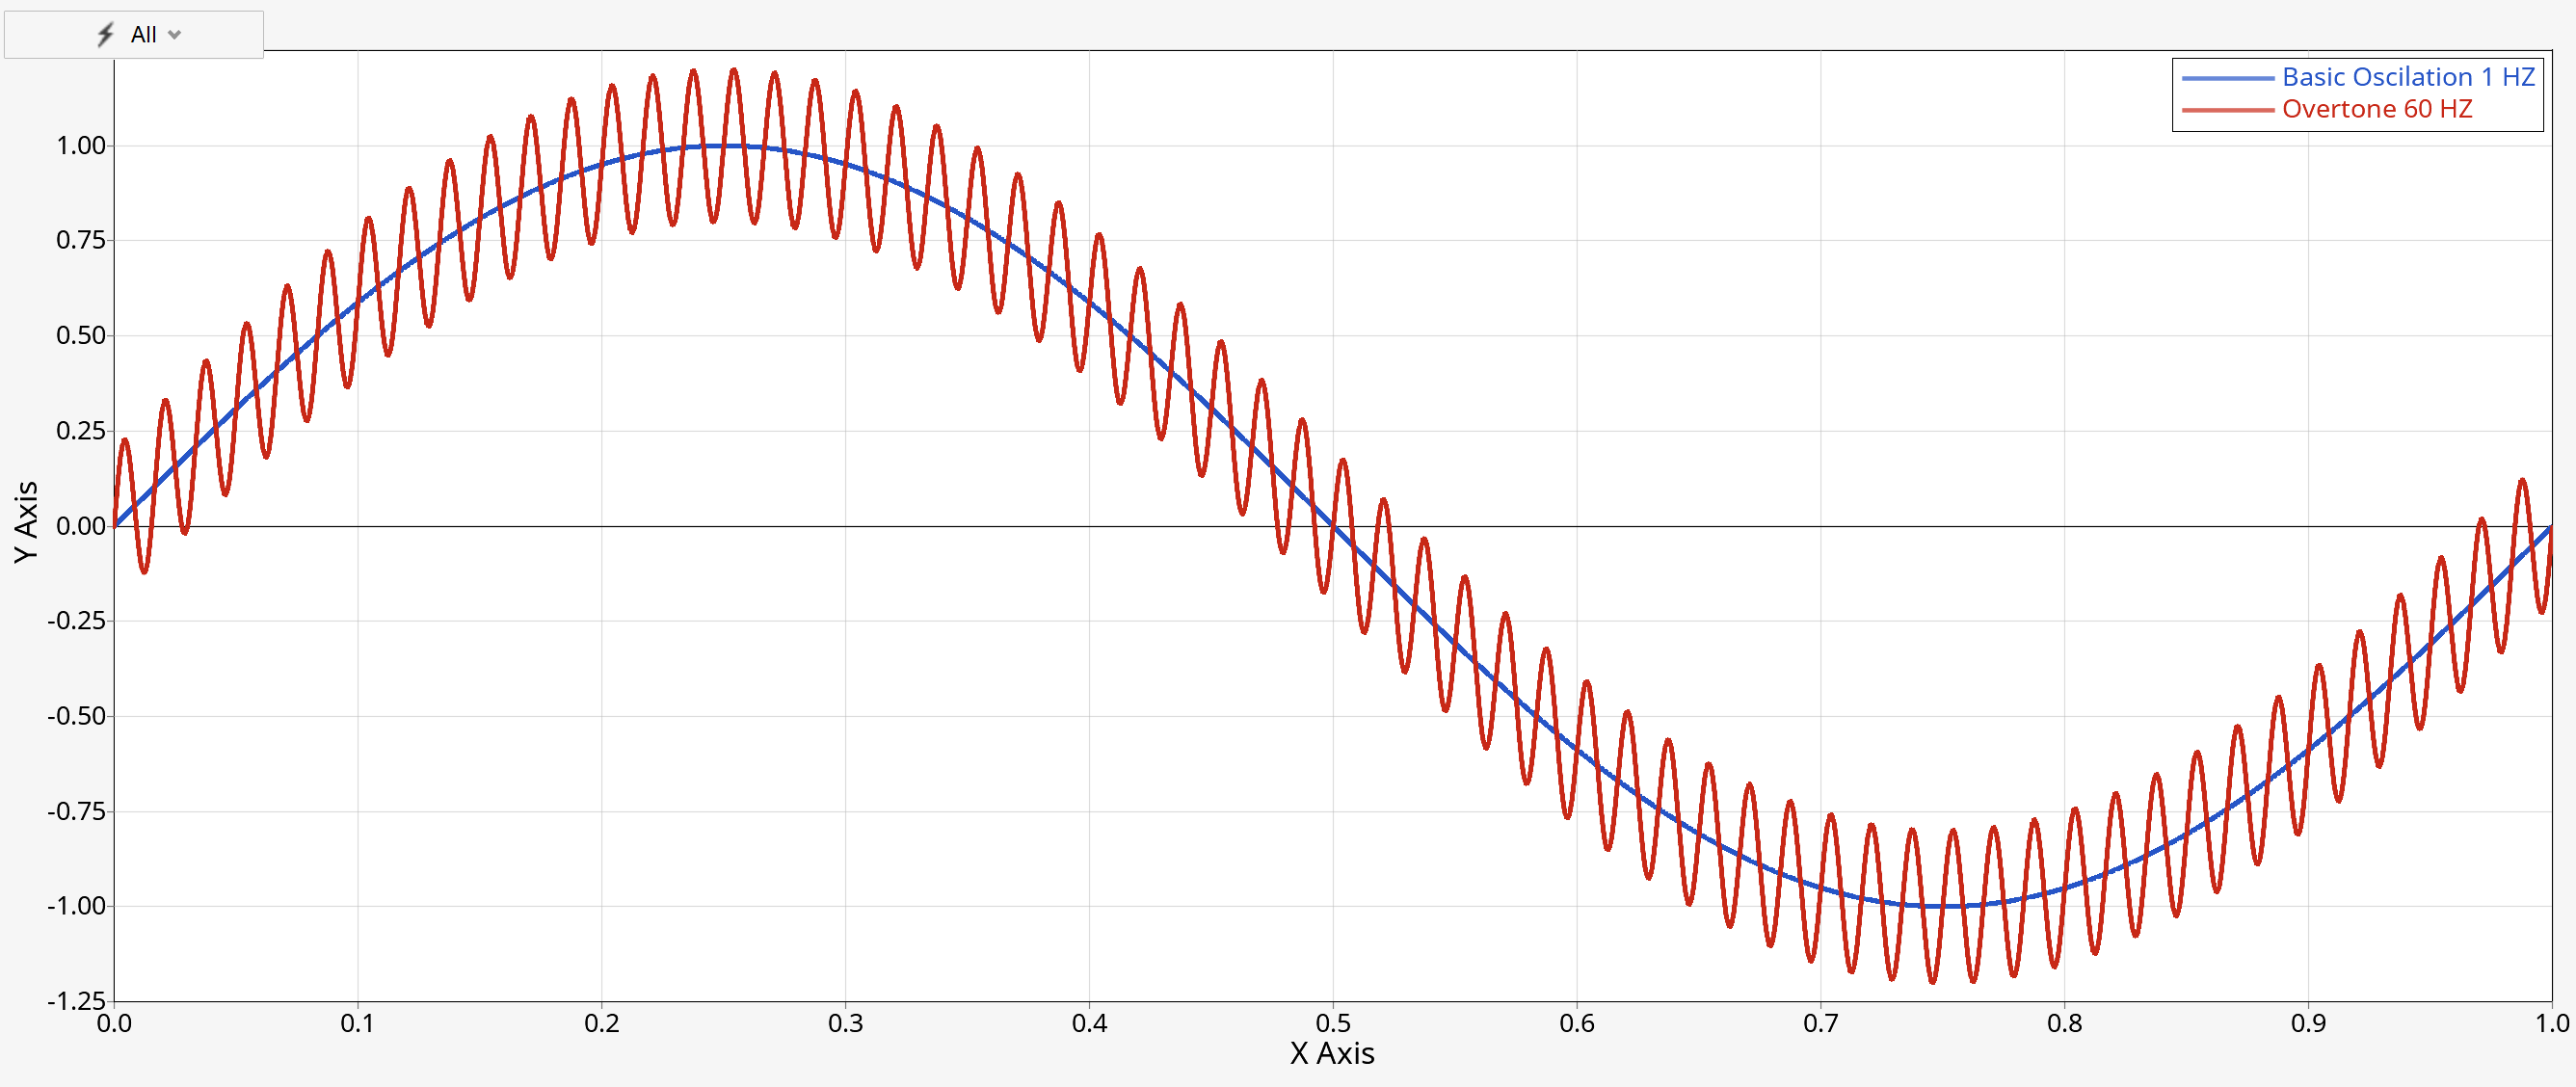
Figure 6. Output of ‘Create two curves from math expressions’
Example 02 - Curves from File#
 1from hw import *
 2from hw.hg import *
 3import os
 4
 5ALTAIR_HOME = os.path.abspath(os.environ["ALTAIR_HOME"])
 6plotFile = os.path.join(
 7    ALTAIR_HOME, "demos", "mv_hv_hg", "plotting", "madymo", "ANGACC"
 8)
 9
10ses = Session()
11ses.new()
12win = ses.get(Window)
13win.type = "xy"
14
15requestList = ["50th% Hybrid3   - LOWER TORSO", "50th% Hybrid3   - UPPER TORSO"]
16colorList = [(255, 0, 0), (0, 0, 255)]
17
18for color, request in zip(colorList, requestList):
19    cu = CurveXY(
20        xFile=plotFile,
21        xSource="file",
22        xDataType="Time",
23        xRequest="Time",
24        xComponent="Time",
25        yFile=plotFile,
26        ySource="file",
27        yDataType="Angular Acceleration",
28        yRequest=request,
29        yComponent="Res. ang. acc.",
30        lineColor=color,
31        label="{y.HWRequest} - {y.HWComponent}",
32    )
33
34win.update()
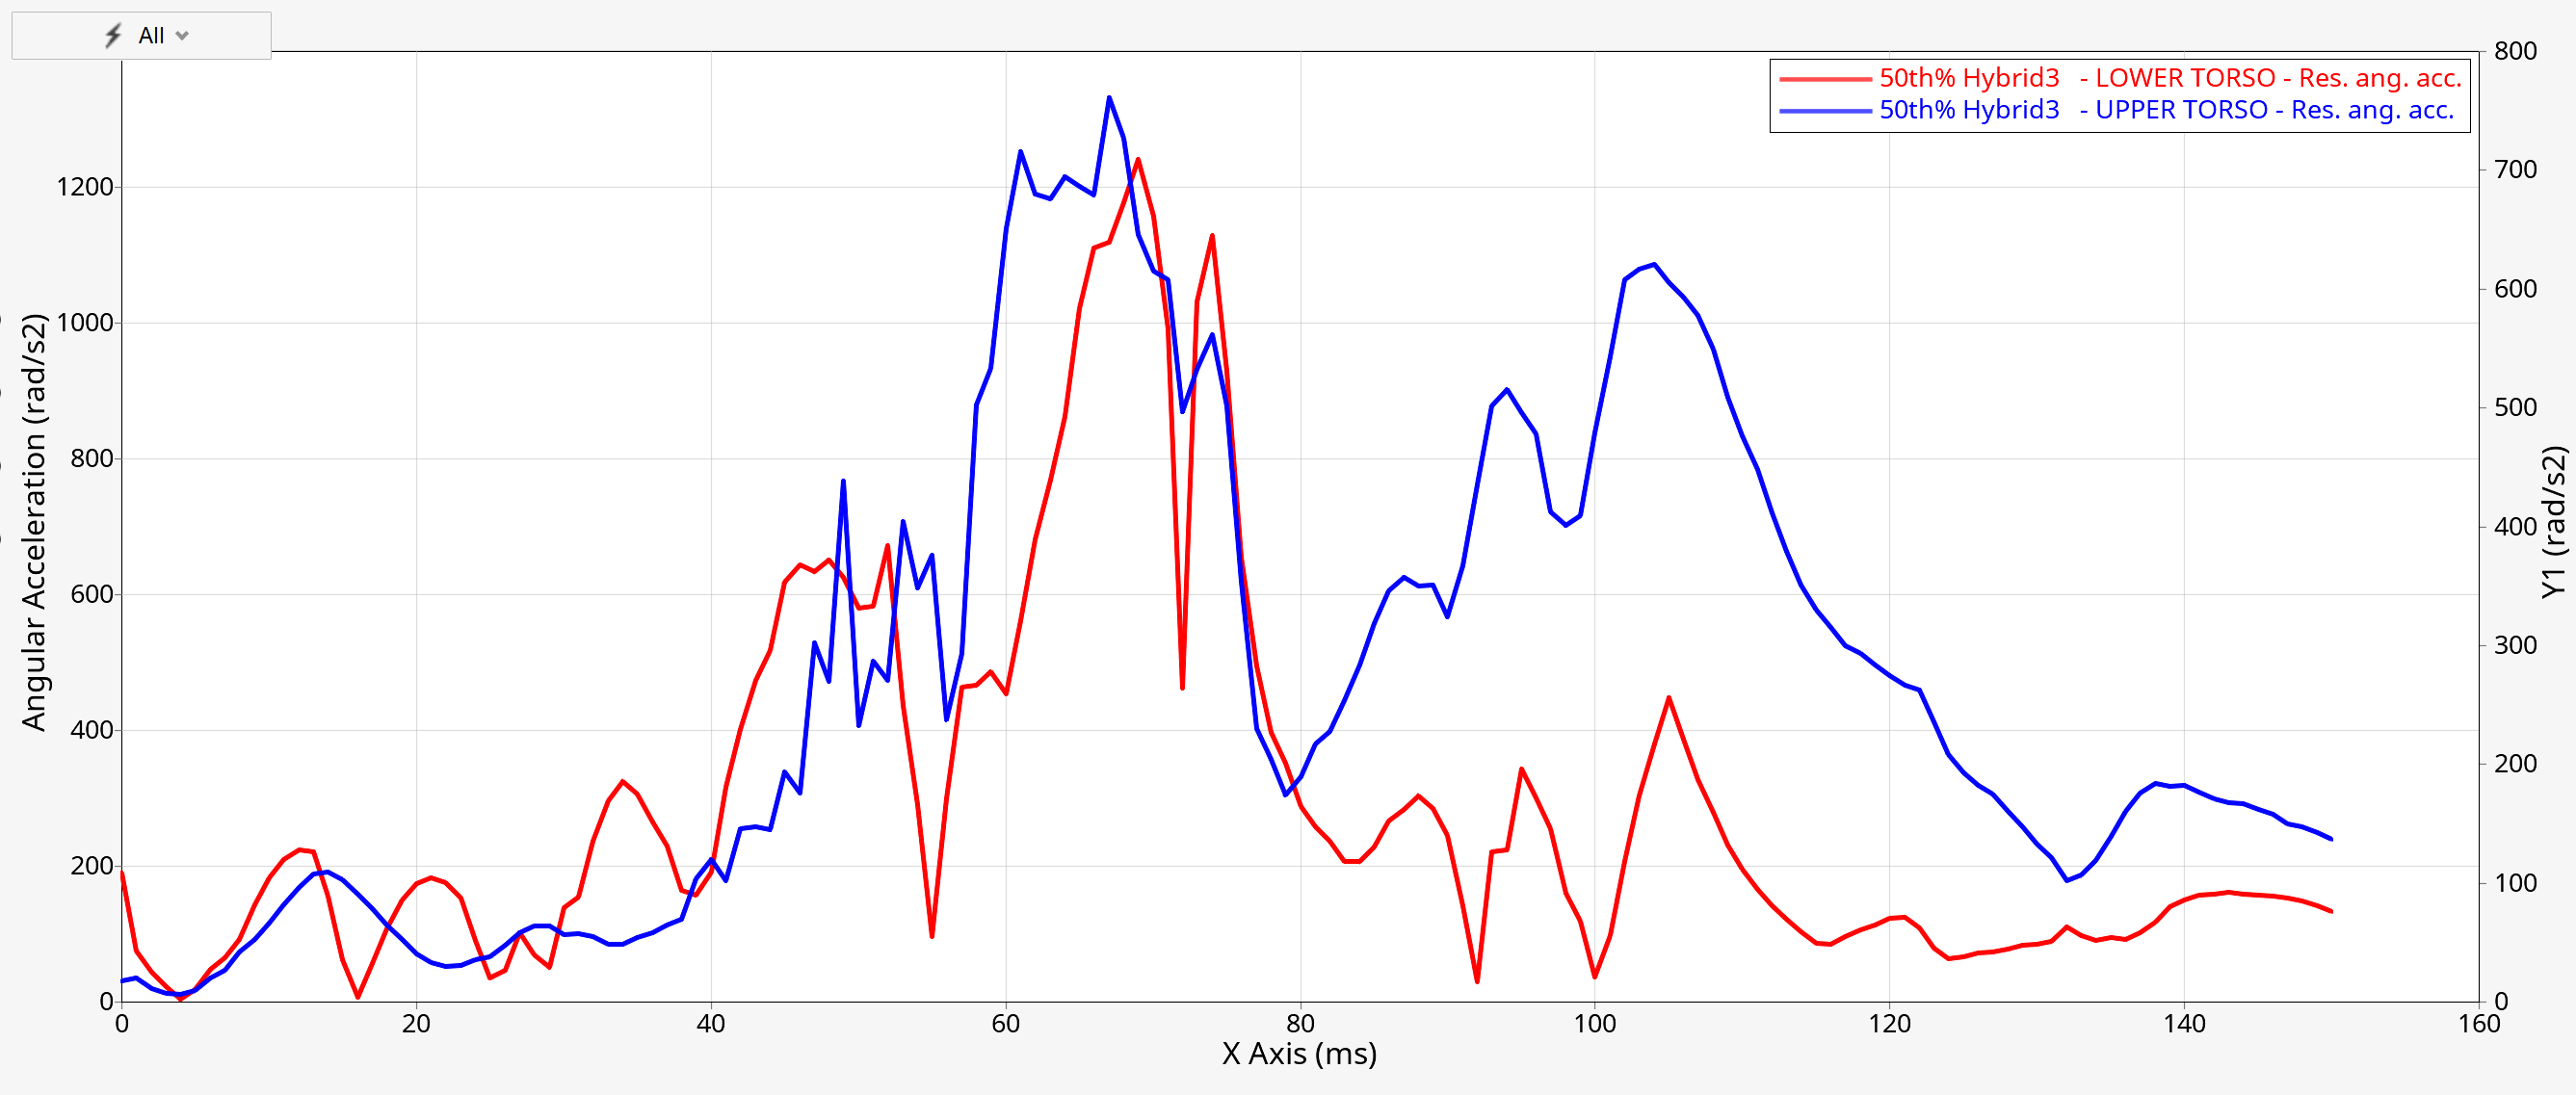
Figure 7. Output of ‘Load two curves from file, define color and label’
Example 03 - Curves from Files, Datums, Notes, Legends and PNG, XYDATA Export#
 1from hw import *
 2from hw.hg import *
 3import os
 4
 5ALTAIR_HOME = os.path.abspath(os.environ["ALTAIR_HOME"])
 6plotFile = os.path.join(
 7    ALTAIR_HOME, "demos", "mv_hv_hg", "plotting", "madymo", "ANGACC"
 8)
 9jpgFile = os.path.join(
10    os.path.abspath(os.path.dirname(__file__)), "HG_Image_Export.png"
11)
12xyDataFile = os.path.join(
13    os.path.abspath(os.path.dirname(__file__)), "HG_Curve_Export.xydata"
14)
15
16# New session
17ses = Session()
18ses.new()
19win = ses.get(Window)
20win.type = "plot"
21
22# Define image and curve export tools
23captureImage = CaptureImageTool(
24    file=jpgFile,
25    type="png",
26    width=2000,
27    height=1000,
28)
29exportCurves = ExportCurves(file=xyDataFile, format="xyData", range="all")
30
31# Layout and channel settings
32colorList = [(255, 0, 0), (0, 0, 255)]
33requestList = ["50th% Hybrid3   - LOWER TORSO", "50th% Hybrid3   - UPPER TORSO"]
34autoPosList = ["right", "left"]
35
36# Loop over curves, notes and datums
37for color, request, autoPos in zip(colorList, requestList, autoPosList):
38
39    # Add curves
40    cu = CurveXY(
41        xFile=plotFile,
42        xSource="file",
43        xDataType="Time",
44        xRequest="Time",
45        xComponent="Time",
46        yFile=plotFile,
47        ySource="file",
48        yDataType="Angular Acceleration",
49        yRequest=request,
50        yComponent="Res. ang. acc.",
51        lineColor=color,
52        label="{y.HWRequest} - {y.HWComponent}",
53    )
54
55    # Add curve math
56    cu.mathAdd("SAE", padding=1, direction=1, filterClass=15)
57    cu.mathAdd("trim", start=20, end=130)
58
59    cuId = str(cu.id)
60
61    # Add note attached to curve math
62    no = Note(
63        attachTo="curve",
64        attachmentCurve=cu.id,
65        attachmentPoint="indexofmax(c" + cuId + ".y)",
66        text="Max = {y} at {x}",
67        autoPosition=True,
68        autoPositionStrategy=autoPos,
69        curveColor=True,
70    )
71
72    # Add vertical datum
73    dv = DatumVertical(
74        position="c" + cuId + ".x[indexofmax(c" + cuId + ".y)]",
75        label="Max " + cu.yRequest,
76        labelLocation="upperCenter",
77        lineColor=color,
78    )
79
80# Modify legend
81legend = ses.get(Legend)
82legFont = Font(size=14)
83legend.placement = "insideRightBottomCorner"
84legend.font = legFont
85
86# Shade area between 2 curves
87cu.setAttributes(
88    shadeArea=True,
89    shadeStyle="betweenCurves",
90    shadeSecondCurve=1,
91    shadeColor="Blue",
92    shadeAlpha=0.2,
93)
94
95win.update()
96
97# Export image and modified curve values in XYDATA format
98captureImage.capture()
99exportCurves.export()
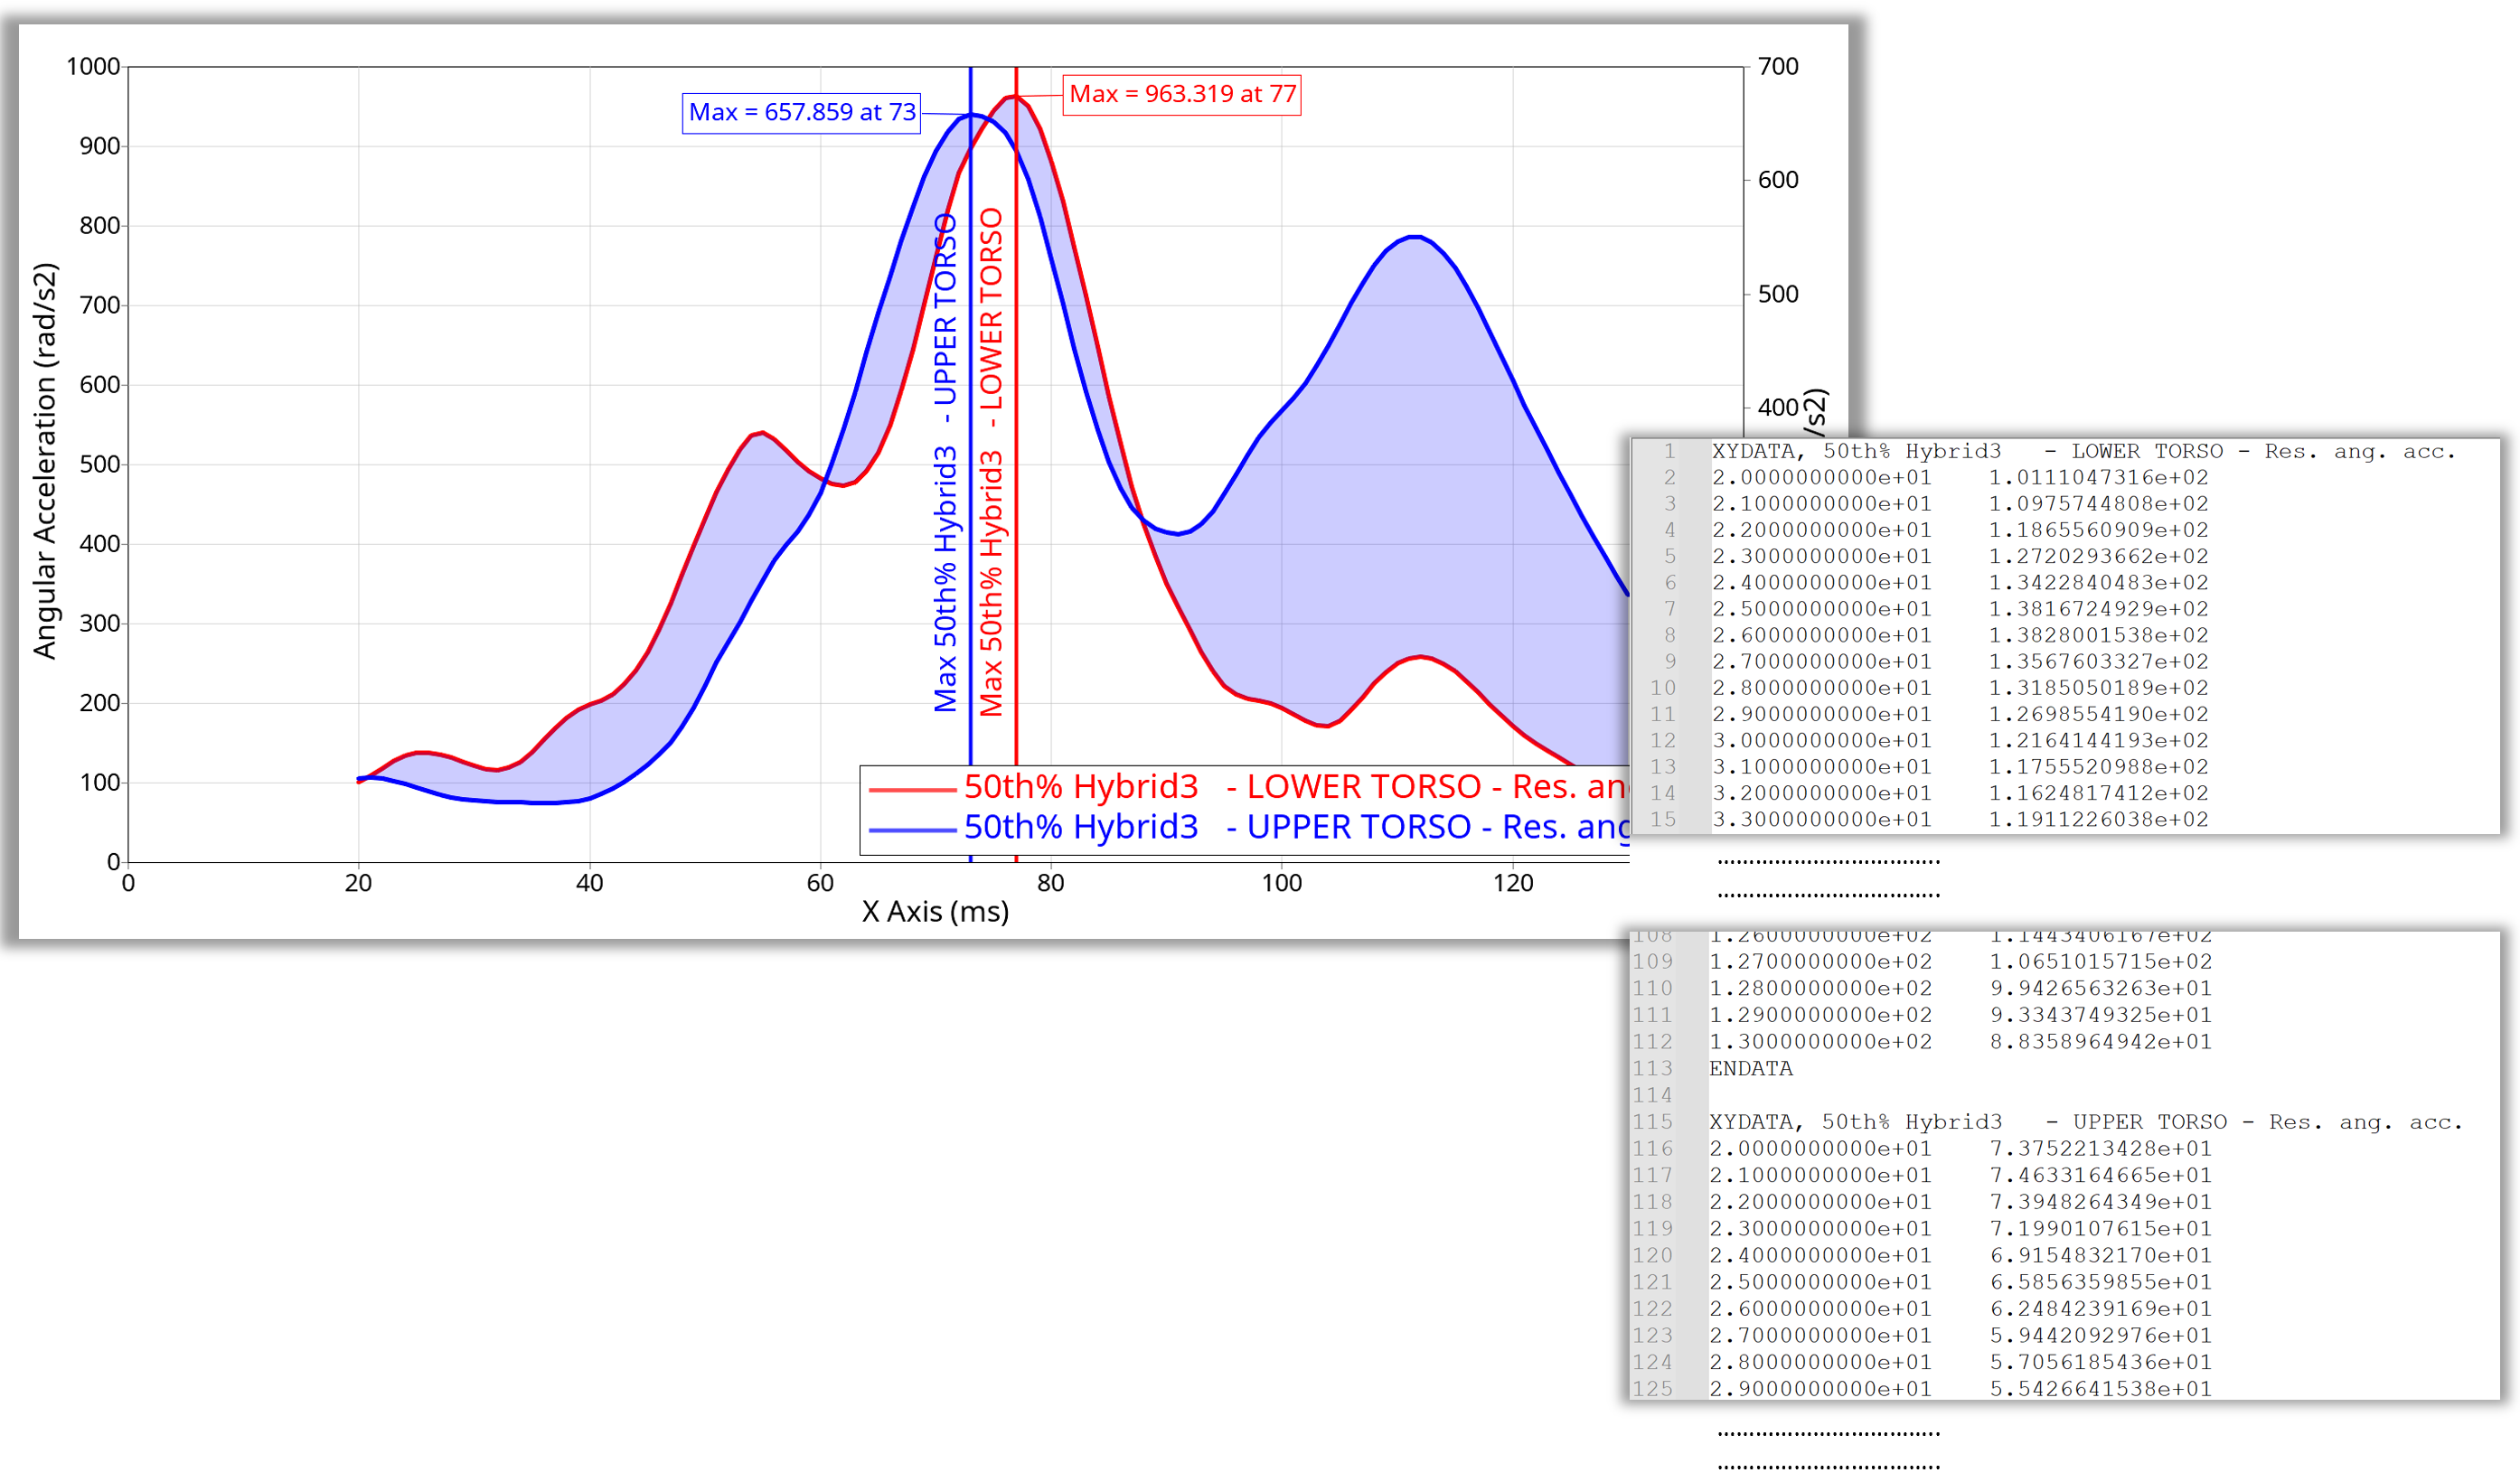
Figure 8. Exported Image of script ‘Curves from Files, Datums, Notes, Legends and PNG, XYDATA Export’
Example 04 - evalHWC() for Curve Import and Math Operations#
 1from hw import *
 2from hw.hg import *
 3import os
 4
 5src_path = os.path.dirname(os.path.abspath(__file__))
 6plotFile = os.path.join(src_path, "ANGACC")
 7
 8# New session
 9evalHWC("delete session")
10# Set Client Type to HyperGraph
11evalHWC('hwd window type="HyperGraph 2D"')
12# Load curves with build plots module
13evalHWC("xy option layout destination=oneplotperrequest")
14evalHWC("xy option layout layout=1")
15evalHWC(
16    "xy load file="
17    + plotFile
18    + ' ydatatype= "Angular Acceleration" \
19            yrequest= "50th% Hybrid3   - LOWER TORSO" , "50th% Hybrid3   - UPPER TORSO" ycomponent= all'
20)
21evalHWC(
22    'xy curve stackadd range="w:all i:all" operation=trim start=20 end=130 interpolate=false'
23)
24# Add curve math for all curves in current plot
25evalHWC(
26    'xy curve stackadd range="w:all i:all" operation=SAE padding=1 samples=10 direction=3 filterClass=60'
27)
28evalHWC(
29    'xy curve stackadd range="w:all i:all" operation=resample type="Resample Fixed Points" fixnum=100.0'
30)
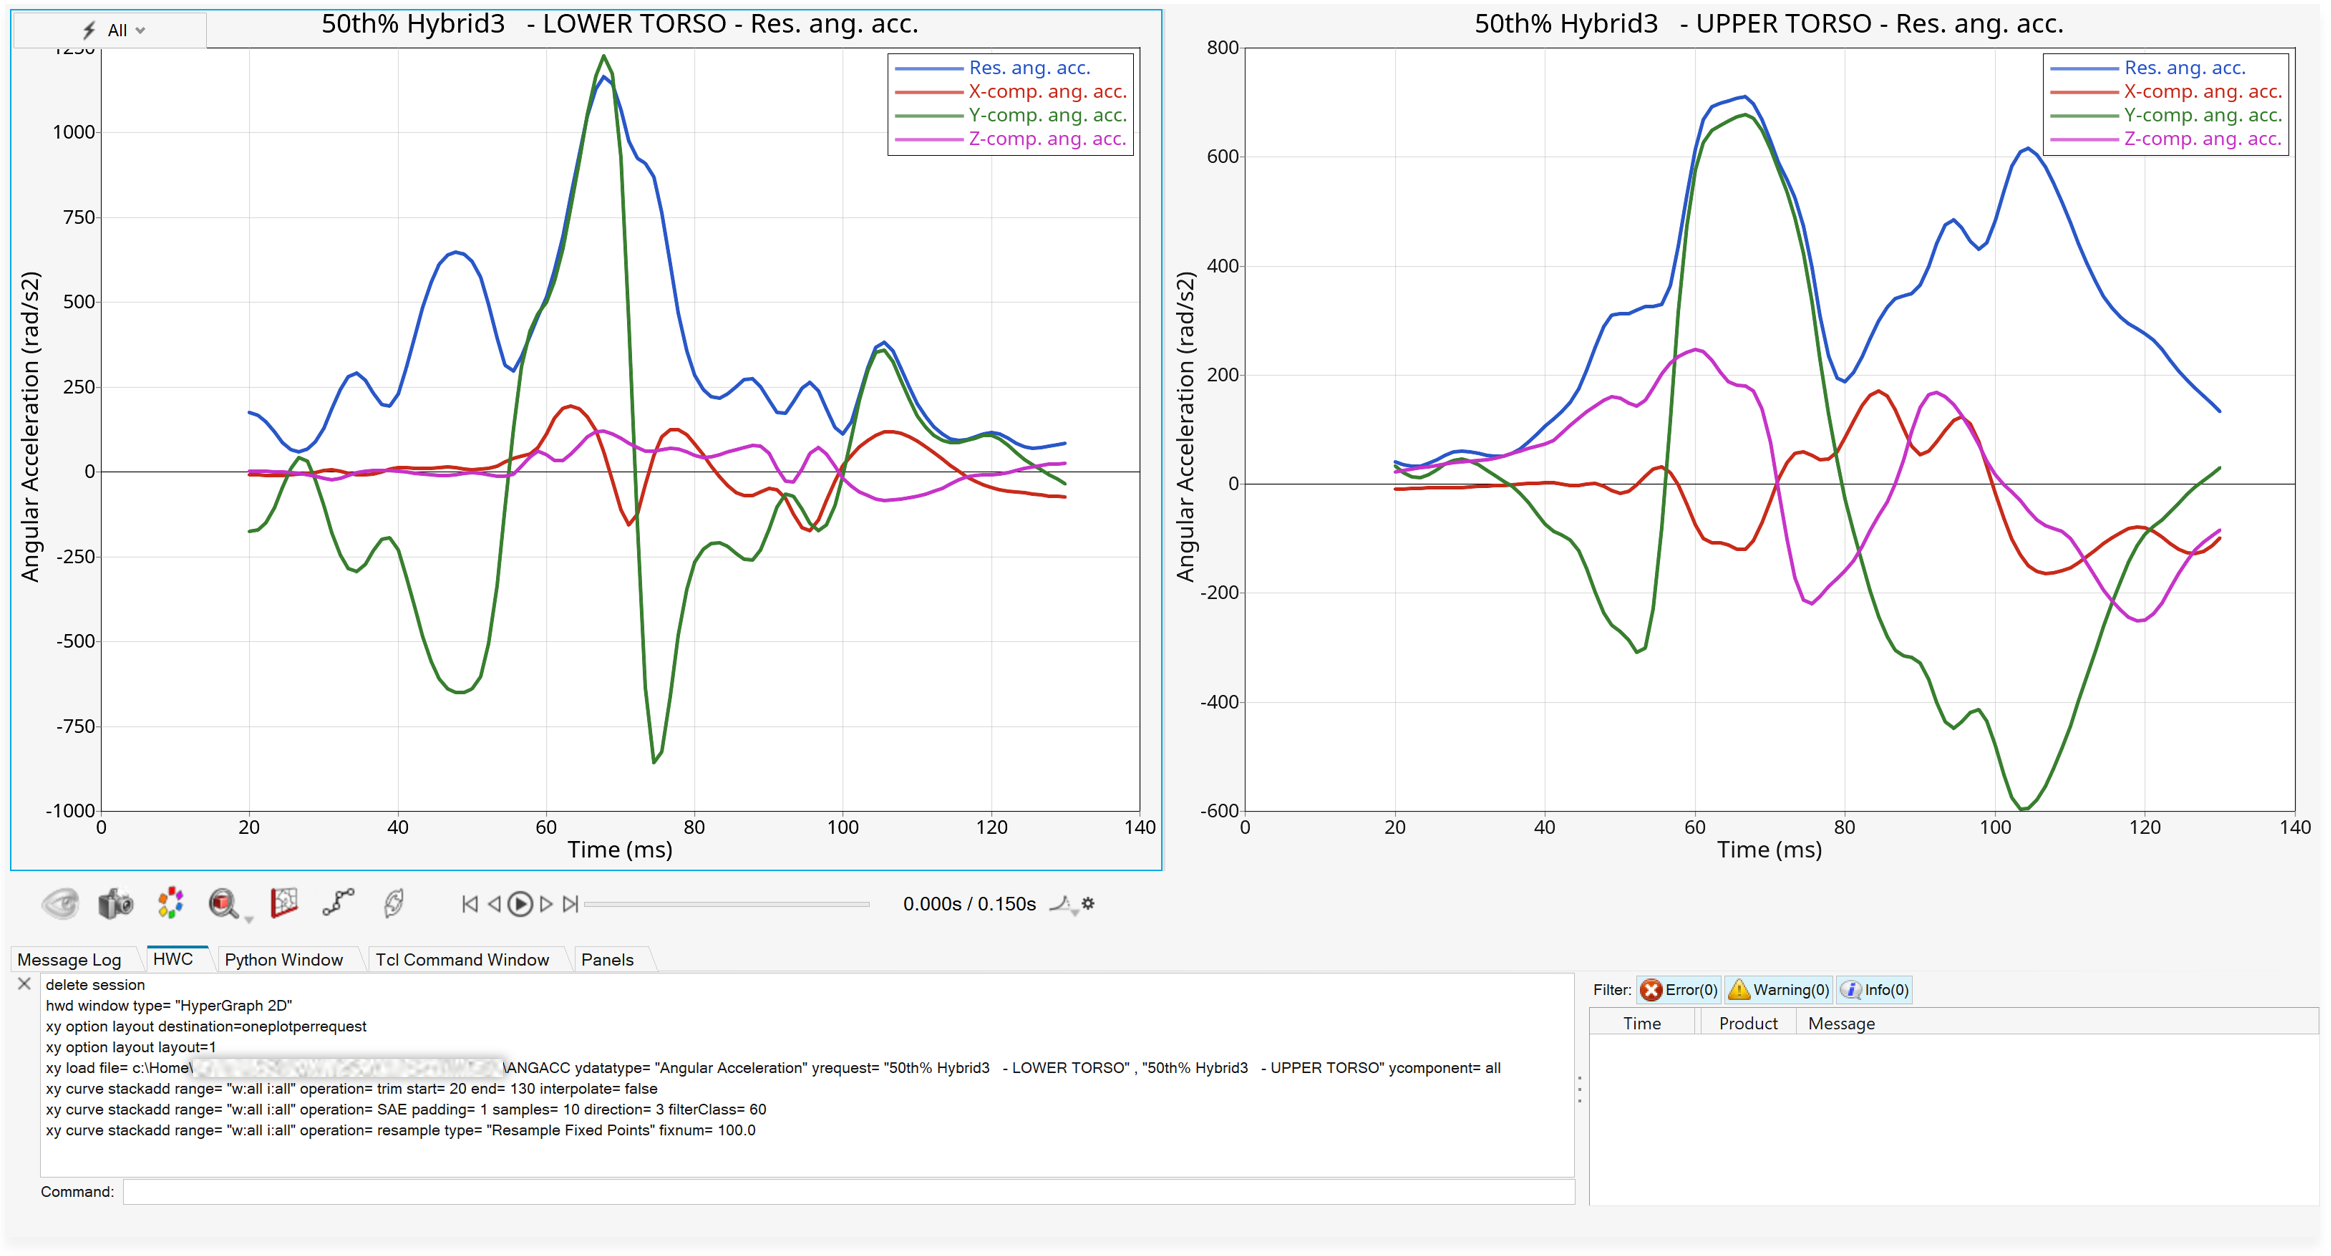
Figure 9. Output of ‘evalHWC() for Curve Import and Math Operations’
Example 05 - Create Multiple Plot Layout#
  1from hw import *
  2from hw.hg import *
  3import os
  4
  5ALTAIR_HOME = os.path.abspath(os.environ["ALTAIR_HOME"])
  6plotFile = os.path.join(
  7    ALTAIR_HOME, "demos", "mv_hv_hg", "plotting", "madymo", "ANGACC"
  8)
  9
 10# New Session
 11ses = Session()
 12ses.new()
 13
 14# Dictionary with curve channel names
 15plotDict = {
 16    "yRequests": [
 17        "50th% Hybrid3   - LOWER TORSO",
 18        "50th% Hybrid3   - UPPER TORSO",
 19        "50th% Hybrid3   - UPPER LEG RIGHT",
 20        "50th% Hybrid3   - UPPER LEG LEFT",
 21    ],
 22    "yComponents": [
 23        "Res. ang. acc.",
 24        "X-comp. ang. acc.",
 25        "Y-comp. ang. acc.",
 26        "Z-comp. ang. acc.",
 27    ],
 28    "lineColors": ["#ff0000", "#00ff00", (0, 0, 255), (0, 0, 0)],
 29}
 30
 31# Create fonts and colors
 32fontAxisText = Font(family="Arial", style="regular", size=14)
 33legendBorderColor = Color(rgb=(204, 204, 204))
 34datumColor = Color(hex="#ff0000")
 35
 36# Loop over pages
 37for index in range(1, 3):
 38    ap = ses.get(Page)
 39    if index > 1:
 40        ap = Page()
 41    ses.setActive(Page, id=index)
 42
 43    # Define page attributes
 44    ap.setAttributes(layout=9, title="HG Demo " + str(index))
 45    i = 0
 46
 47    # One plot per request
 48    for request in plotDict.get("yRequests"):
 49        i += 1
 50        aw = ses.setActive(Window, window=i)
 51        aw.type = "xy"
 52
 53        # Add curves from dictionary
 54        for component, color in zip(
 55            plotDict.get("yComponents"), plotDict.get("lineColors")
 56        ):
 57            cu = CurveXY(
 58                xFile=plotFile,
 59                xType="file",
 60                xDataType="Time",
 61                xRequest="Time",
 62                xComponent="Time",
 63                yFile=plotFile,
 64                yType="file",
 65                yDataType="Angular Acceleration",
 66                yRequest=request,
 67                yComponent=component,
 68                lineColor=color,
 69                label="{y.HWRequest} - {y.HWComponent}",
 70            )
 71
 72            # Add curve math SAE filter
 73            cu.mathAdd("SAE", padding=1, direction=1, filterClass=15)
 74
 75            # Create and Modify curve math trim operation
 76            mathTrim = cu.mathAdd("trim")
 77            mathTrim.setAttributes(start=20, end=140)
 78
 79        # Add vertical datum line at curve max
 80        dv = DatumVertical(
 81            position="c1.x[indexofmax(c1.y)]",
 82            label="Y Max",
 83            labelLocation="upperCenter",
 84            lineColor=datumColor,
 85        )
 86
 87        # Edit vertical axis label using font object
 88        av = ses.get(AxisVertical, curve=cu)
 89        av.text = "Max of Resultant = {max(c1.y)}"
 90        av.font = fontAxisText
 91
 92        # Modify Header values
 93        header = ses.get(Header)
 94        header.setAttributes(visibility=True, text="Demo Window " + str(i))
 95
 96        # Modify Legend Style
 97
 98        legend = ses.get(Legend)
 99        legend.setAttributes(
100            borderColor=legendBorderColor,
101            borderStyle=3,
102            placement="insideRightBottomCorner",
103        )
104
105        # Create note at maximum of curve 3
106        note = Note(
107            attachTo="curve",
108            attachmentCurve=1,
109            attachmentPoint="indexofmax(c1.y)",
110            text="Max = {y} @ {x}",
111            autoPosition=True,
112            autoPositionStrategy="right",
113            curveColor=True,
114        )
115
116        # Update() recalculates, fits and draws
117        aw.update()
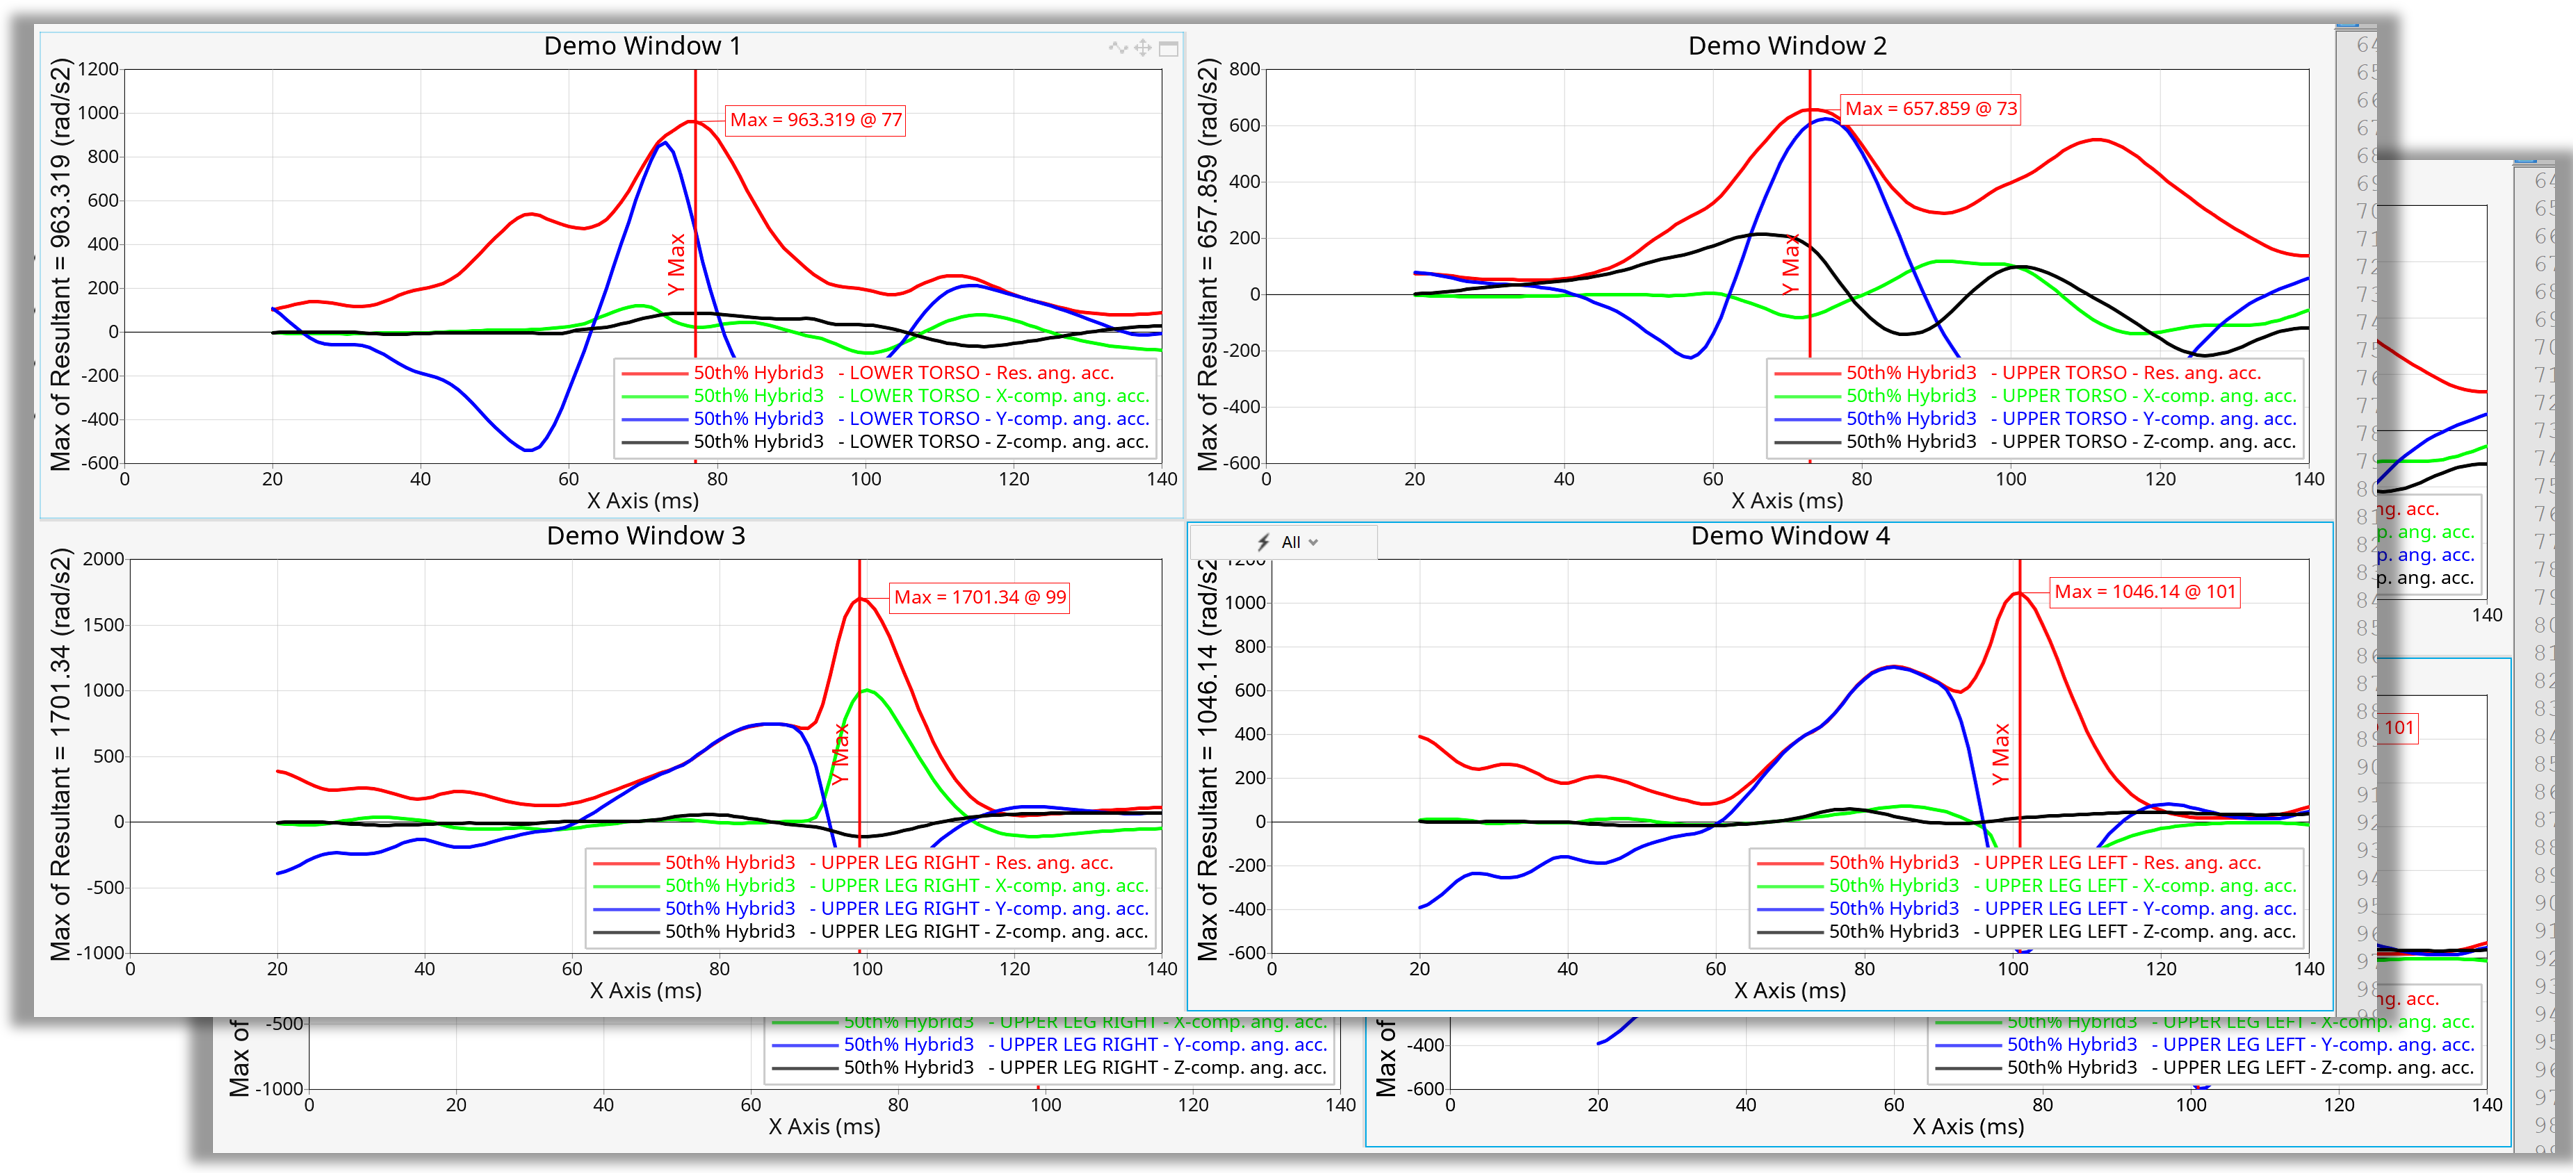
Figure 10. Output of ‘Create Multiple Plot Layout’
Example 06 - Get Channel Info#
 1from hw import *
 2from hw.hg import *
 3import os
 4
 5ALTAIR_HOME = os.path.abspath(os.environ["ALTAIR_HOME"])
 6plotFile = os.path.join(
 7    ALTAIR_HOME, "demos", "mv_hv_hg", "plotting", "madymo", "ANGACC"
 8)
 9
10dtIndex = 1
11dataFile = DataFile(plotFile)
12dataTypeList = dataFile.getDataTypes()
13requestList = dataFile.getRequests(dataTypeList[dtIndex])
14componentList = dataFile.getComponents(dataTypeList[dtIndex])
15metaList = dataFile.getMetaDataList(dataTypeList[1], requestList[0], componentList[0])
16metaValue = dataFile.getMetaDataValue(
17    dataTypeList[1], requestList[0], componentList[0], "HWUnit"
18)
19
20print("Channel Info")
21print("File = " + plotFile)
22print("Reader Version = " + str(dataFile.readerVersion))
23print("Data Types")
24for dataType in dataTypeList:
25    print("  " + dataType)
26print("Requests of DataType = " + dataTypeList[dtIndex])
27for request in requestList:
28    print("    " + request)
29print("Components of DataType = " + dataTypeList[dtIndex])
30for component in componentList:
31    print("      " + component)
32print("Meta Data Label = " + metaList[0])
33print("      Value = " + metaValue)
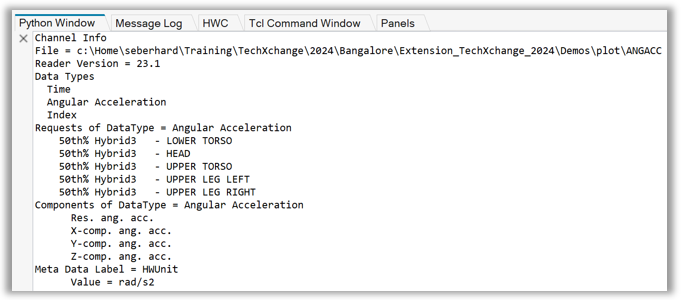
Figure 11. Console Output of ‘Get Channel Info’
Example 07 - Create Data Frames from Plot Files#
 1from hw import *
 2from hw.hg import *
 3import os
 4import matplotlib.pyplot as plt
 5
 6scriptDir = os.path.abspath(os.path.dirname(__file__))
 7plotFile = os.path.join(scriptDir, "plot", "ANGACC")
 8
 9dtIndex = 1
10dataFile = DataFile(plotFile)
11dataTypeList = dataFile.getDataTypes()
12requestList = dataFile.getRequests(dataTypeList[dtIndex])
13componentList = dataFile.getComponents(dataTypeList[dtIndex])
14
15dataFileQuery = DataFileQuery(plotFile)
16dataFileQuery.dataType = dataTypeList[dtIndex]
17dataFileQuery.requests = "all"
18dataFileQuery.components = "all"
19dataFileQuery.includeTime = True
20
21print("Numpy Array")
22numpyArr = dataFileQuery.run("numpy")
23print(numpyArr)
24
25print()
26print("Plot Pandas Data Frame")
27pandasDataFrame = dataFileQuery.run("pandas")
28pandasDataFrame.plot(figsize=(25, 20))
29plt.show()
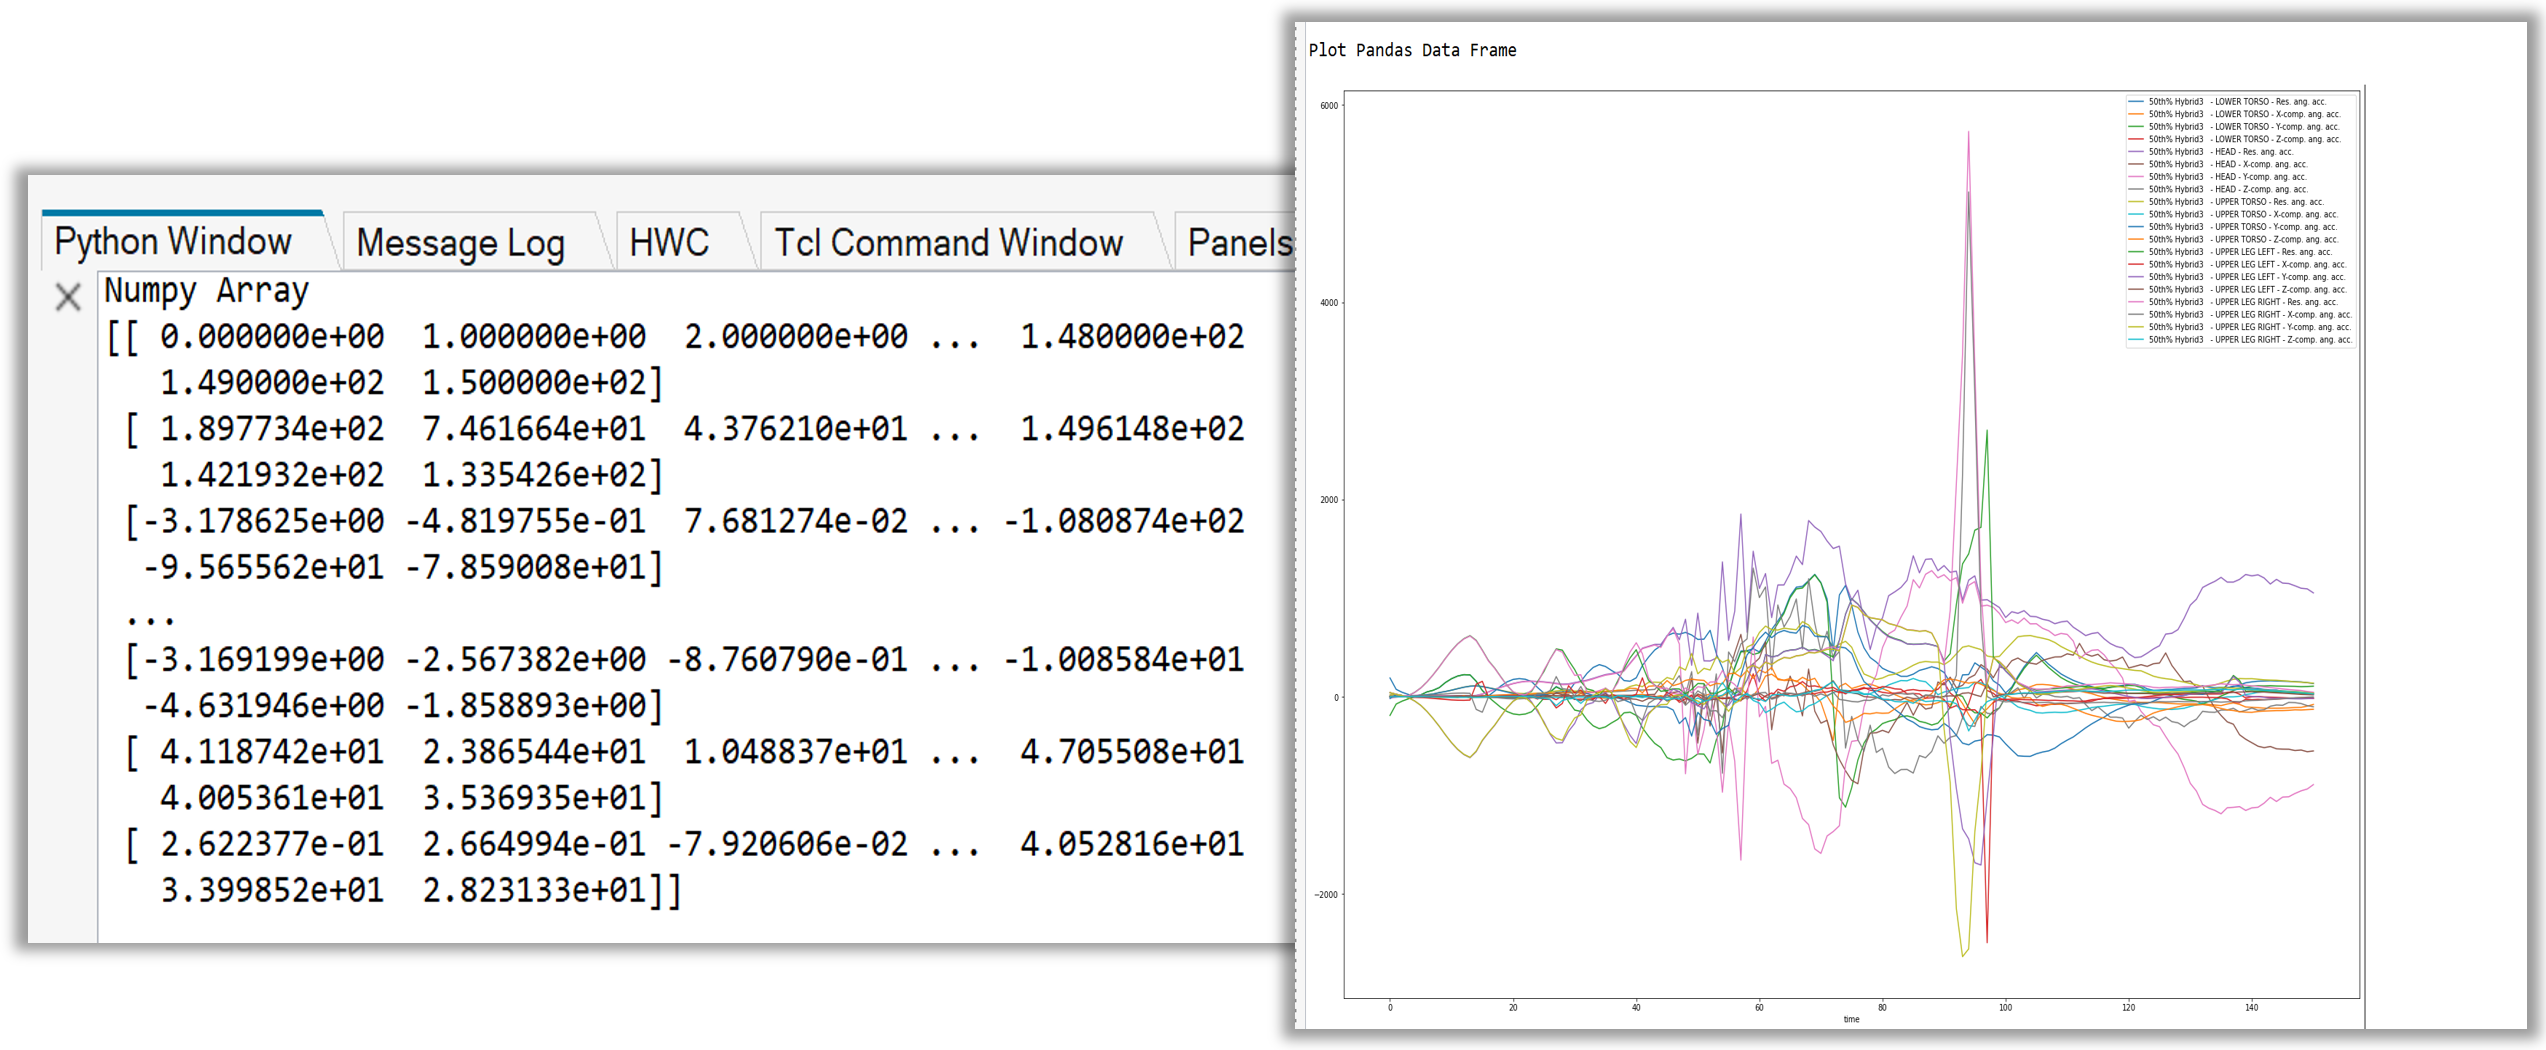
Figure 12. Console Output of ‘Create Data Frames from Plot Files’
Example 08 - Complex Curve#
 1from hw import *
 2from hw.hg import *
 3
 4scriptDir = os.path.abspath(os.path.dirname(__file__))
 5plotFile = os.path.join(scriptDir, "plot", "control_arm_sol111.pch")
 6
 7s = Session()
 8s.new()
 9# evalHWC('hwd window type="HyperGraph 2D"')
10w = s.get(Window)
11w.type = "complex"
12w.axisMode = "ri"
13
14yrCompList = ["REL | X-Trans", "REL | Y-Trans", "REL | Z-Trans"]
15yiCompList = ["IMG | X-Trans", "IMG | Y-Trans", "IMG | Z-Trans"]
16colorList = ["#ff0000", "#00ff00", "#0000ff"]
17
18for yrComp, yiComp, color in zip(yrCompList, yiCompList, colorList):
19    cu = CurveComplex(
20        xFile=plotFile,
21        label=yrComp.split(" ")[-1],
22        xSource="file",
23        xDataType="Frequency [Hz]",
24        xRequest="Frequency [Hz",
25        xComponent="Frequency [Hz",
26        yrFile=plotFile,
27        yrSource="file",
28        yrDataType="Displacements",
29        yrRequest="Point id 2086",
30        yrComponent=yrComp,
31        yiFile=plotFile,
32        yiSource="file",
33        yiDataType="Displacements",
34        yiRequest="Point id 2086",
35        yiComponent=yiComp,
36        lineColor=color,
37        window=1,
38        page=1,
39    )
40
41cu.shadeArea = True
42cu.shadeStyle = "betweenCurves"
43cu.shadeSecondCurve = 2
44cu.shadeColor = (0, 0, 0)
45cu.shadeAlpha = 0.2
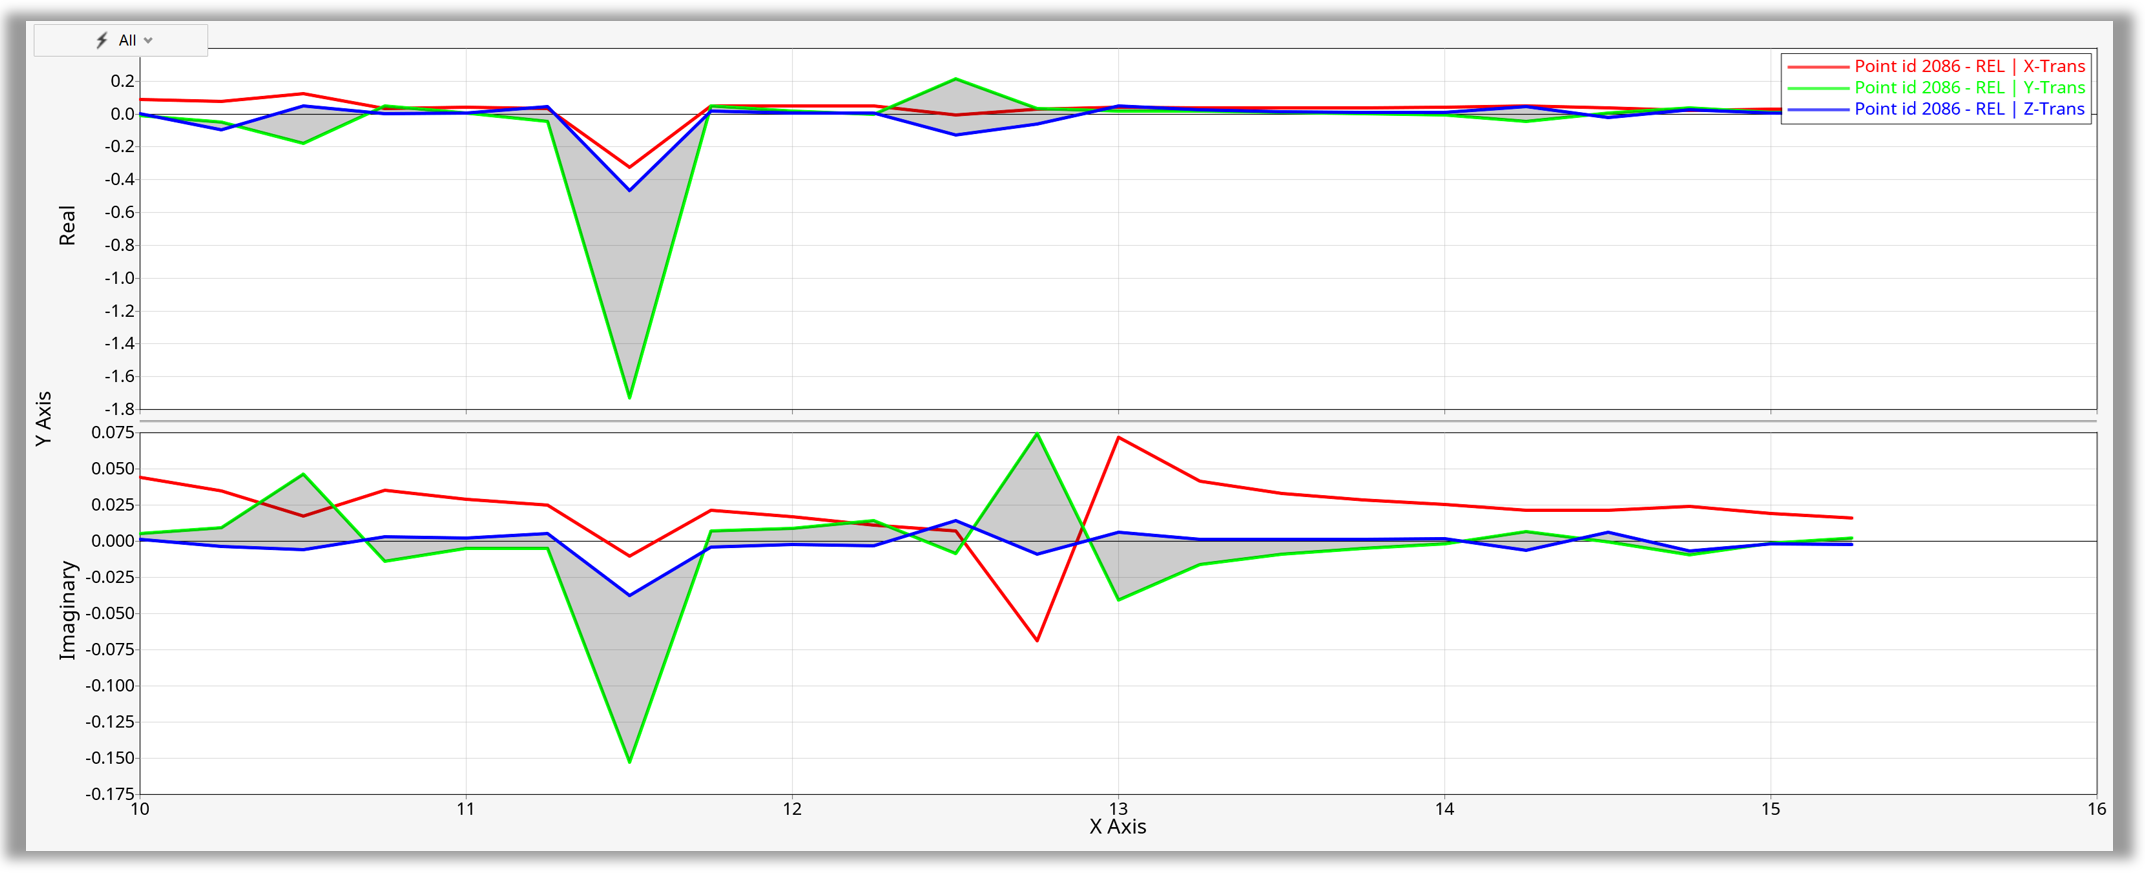
Figure 13. Complex Curve
Example 09 - Plotting Curves from Single File#
 1from hw import *
 2from hw.hg import *
 3import os
 4
 5scriptDir = os.path.abspath(os.path.dirname(__file__))
 6plotFile = os.path.join(scriptDir, "plot", "ANGACC")
 7
 8ses = Session()
 9ses.new()
10# evalHWC('hwd window type="HyperGraph 2D"')
11win = ses.get(Window)
12win.type = "xy"
13
14dataTypeList = ["Time", "Angular Acceleration", "Index"]
15dataType = dataTypeList[1]
16
17createCurves = CreateCurvesByFile()
18createCurves.file = plotFile
19createCurves.yDataType = dataType
20createCurves.yRequest = "all"
21createCurves.yComponent = "all"
22createCurves.layoutType = 1
23createCurves.layoutOrganisation = "onePlotPerRequest"
24createCurves.run()
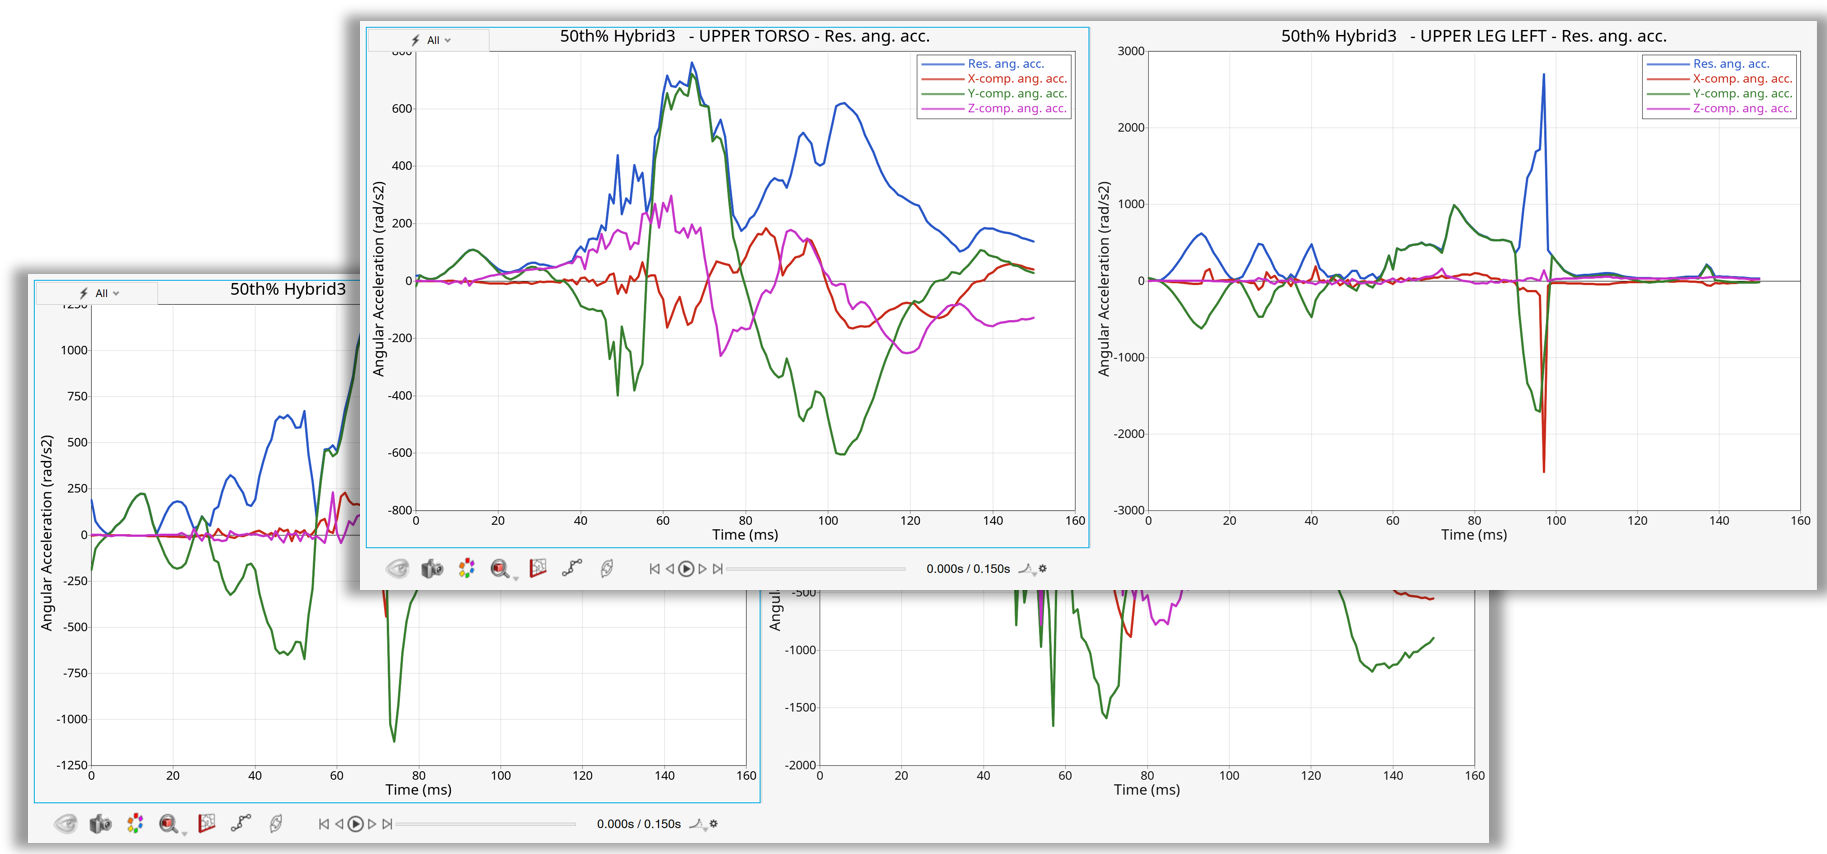
Figure 14. Plotting Curves from Single File
Example 10 - Plotting Curves from Multiple Files#
 1from hw import *
 2from hw.hg import *
 3import os
 4
 5scriptDir = os.path.abspath(os.path.dirname(__file__))
 6multipleFileDir = os.path.join(scriptDir, "doe_1")
 7plotFile = os.path.join(scriptDir, "doe_1", "run__00001", "m_1", "boxbeamT01")
 8
 9ses = Session()
10ses.new()
11win = ses.get(Window)
12win.type = "xy"
13
14dtIndex = 1
15dataFile = DataFile(plotFile)
16dataTypeList = dataFile.getDataTypes()
17requestList = dataFile.getRequests(dataTypeList[dtIndex])
18componentList = dataFile.getComponents(dataTypeList[dtIndex])
19
20multipleFiles = MultipleFiles()
21multipleFiles.name = "FS1"
22multipleFiles.directory = "c:/Home/seberhard/Projects/Python/models/Plot/doe_1"
23multipleFiles.fileList = [
24    "run__00001/m_1/boxbeamT01",
25    "run__00002/m_1/boxbeamT01",
26    "run__00003/m_1/boxbeamT01",
27    "run__00004/m_1/boxbeamT01",
28]
29multipleFiles.labelPrefixSuffix = "dir2"
30multipleFiles.typePrefixSuffix = "prefix"
31fileSet = multipleFiles.createFileSet()
32
33createCurves = CreateCurvesByFile()
34
35createCurves.file = multipleFiles
36
37createCurves.yDataType = dataTypeList[1]
38createCurves.yRequest = requestList[0:2]
39createCurves.yComponent = componentList
40createCurves.layoutType = 1
41createCurves.layoutOrganisation = "onePlotPerRequest"
42createCurves.run()
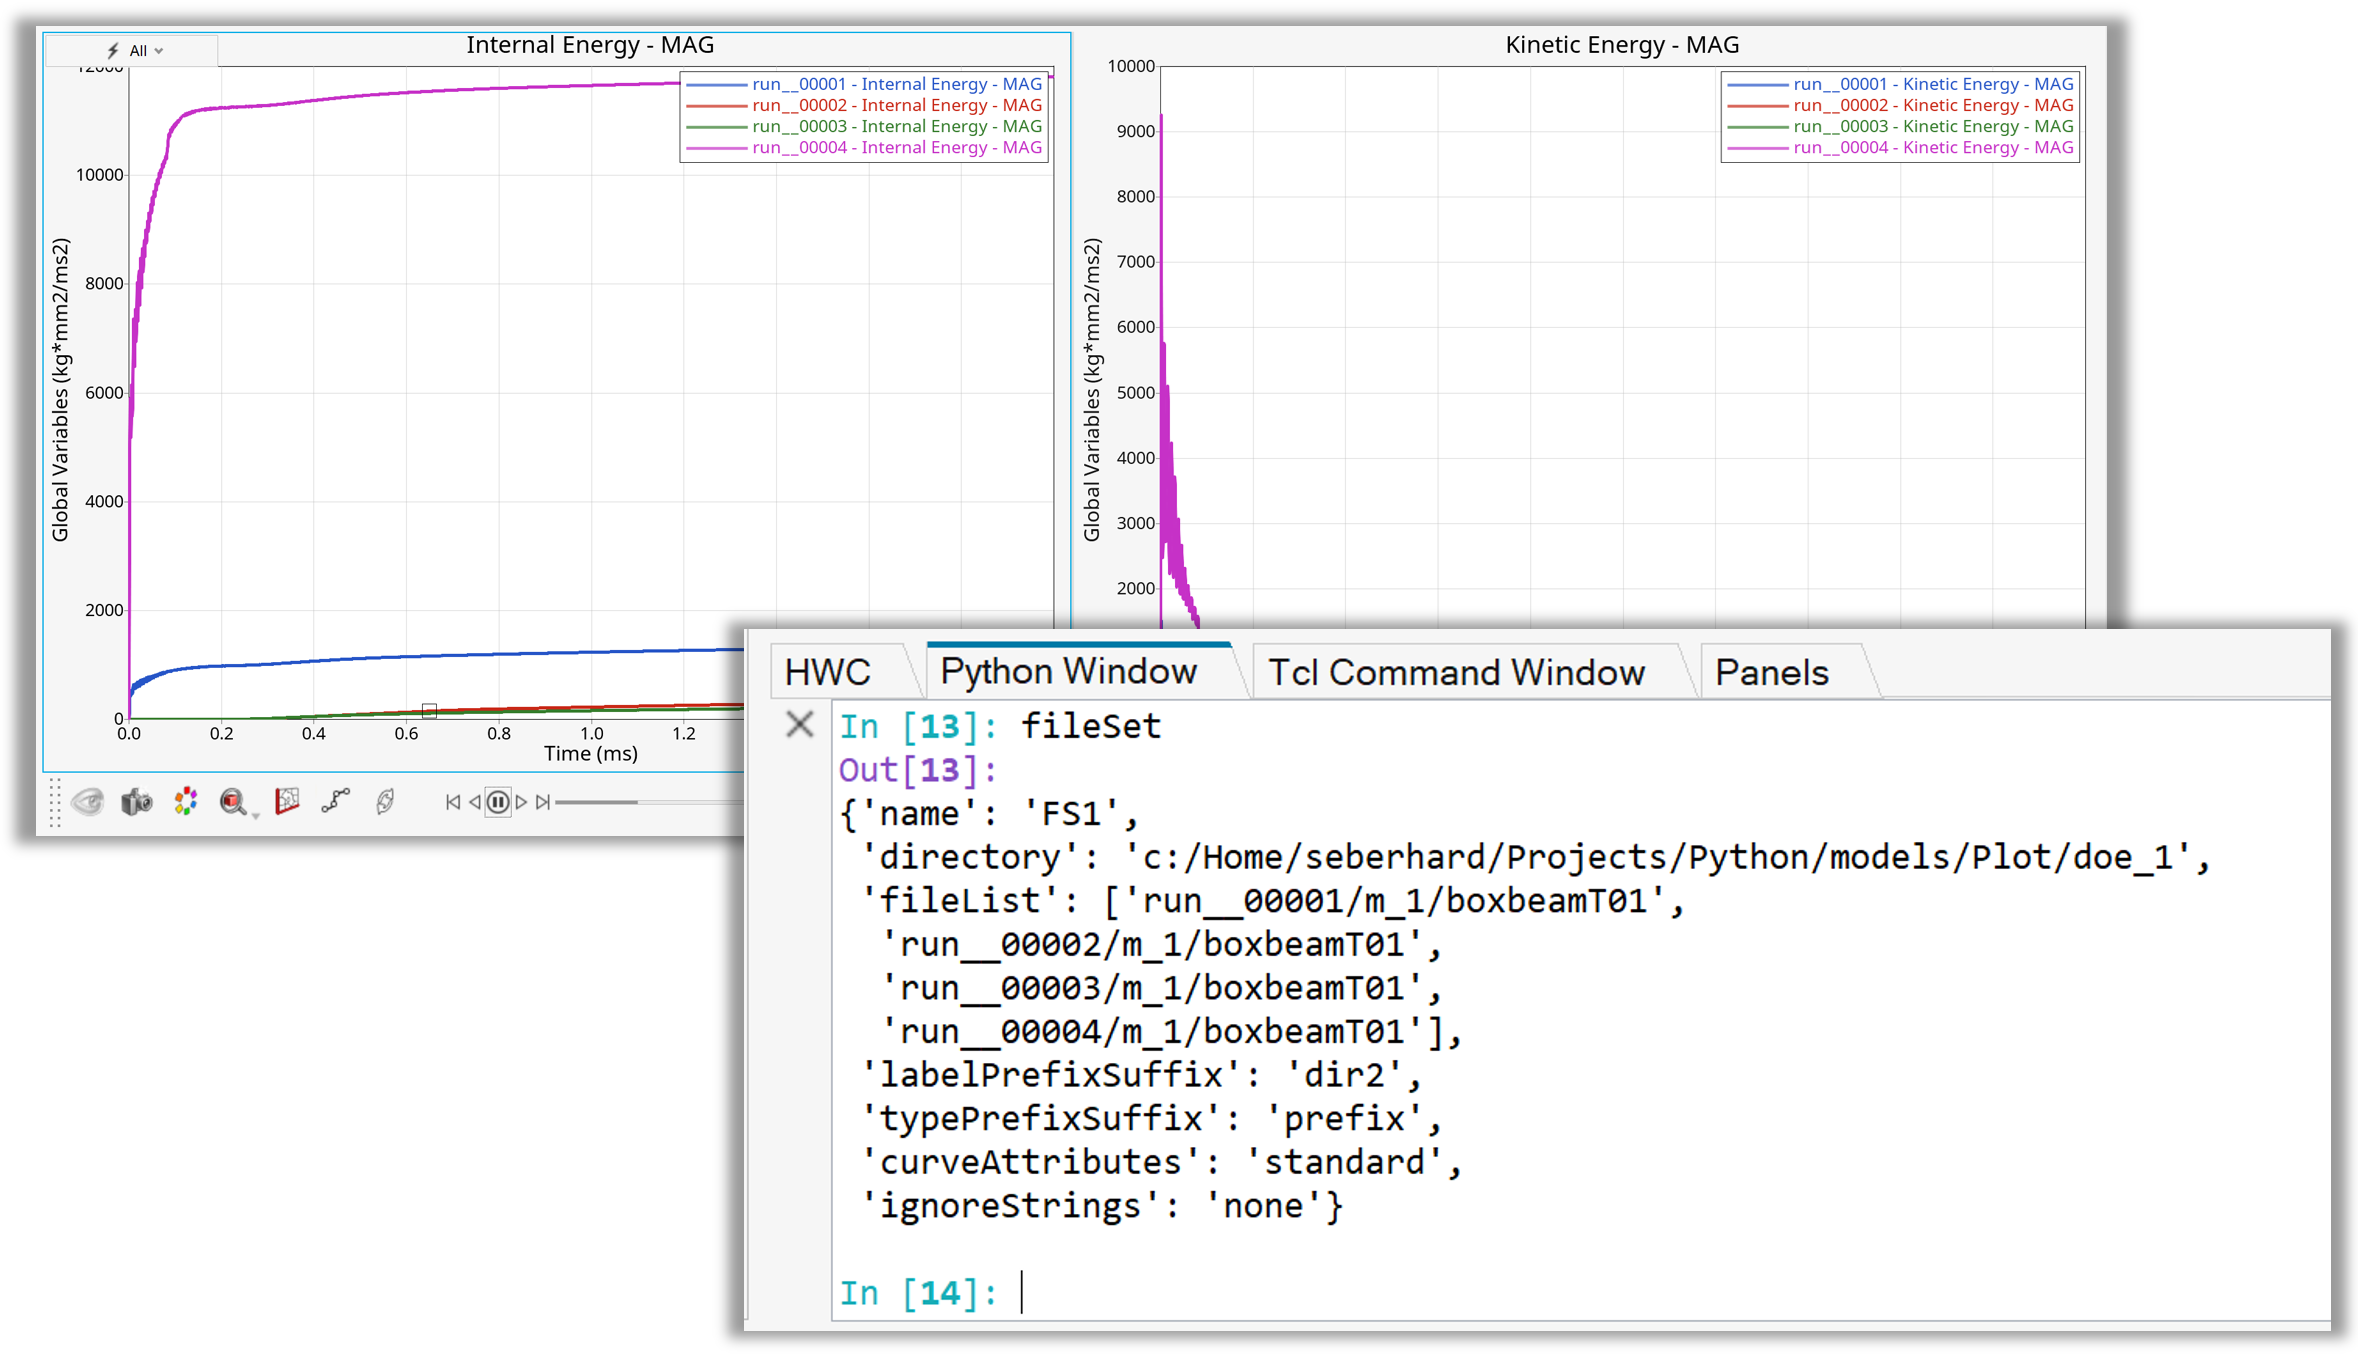
Figure 15. Plotting Curves from Multiple Files
Example 11 - Plotting Curves from Multiple Subcases#
 1    from hw import *
 2    from hw.hg import *
 3    import os
 4
 5    scriptDir = os.path.abspath(os.path.dirname(__file__))
 6    plotFile = os.path.join(scriptDir,'..','Data','plot','10_subcases.h3d').replace("\\","/")
 7
 8    ses = Session()
 9    ses.new()
10    win = ses.get(Window)
11
12    df=DataFile(plotFile)
13    subcaseList = df.getSubcaseLabels()
14    multSub=MultipleSubcases()
15    multSub.file = os.path.normpath(plotFile)
16    multSub.subcaseList=subcaseList
17    multSub.typePrefixSuffix='prefix'
18    subcaseSet = multSub.createSubcaseSet()
19    print(subcaseSet)
20
21    dtl=df.getDataTypes()
22    rl=df.getRequests(dtl[1])
23    cl=df.getComponents(dtl[1])
24
25    createBySub = CreateCurvesBySubcase()
26    createBySub.subcaseSet=multSub
27    createBySub.yDataType=dtl[1]
28    createBySub.yRequest=rl[1:8]
29    createBySub.yComponent=[cl[2],'-',cl[-1]]
30
31    createBySub.yComponentSorting='descending'
32    createBySub.layoutType=9
33    createBySub.layoutOrganisation='onePlotPerRequest'
34
35    createBySub.run()
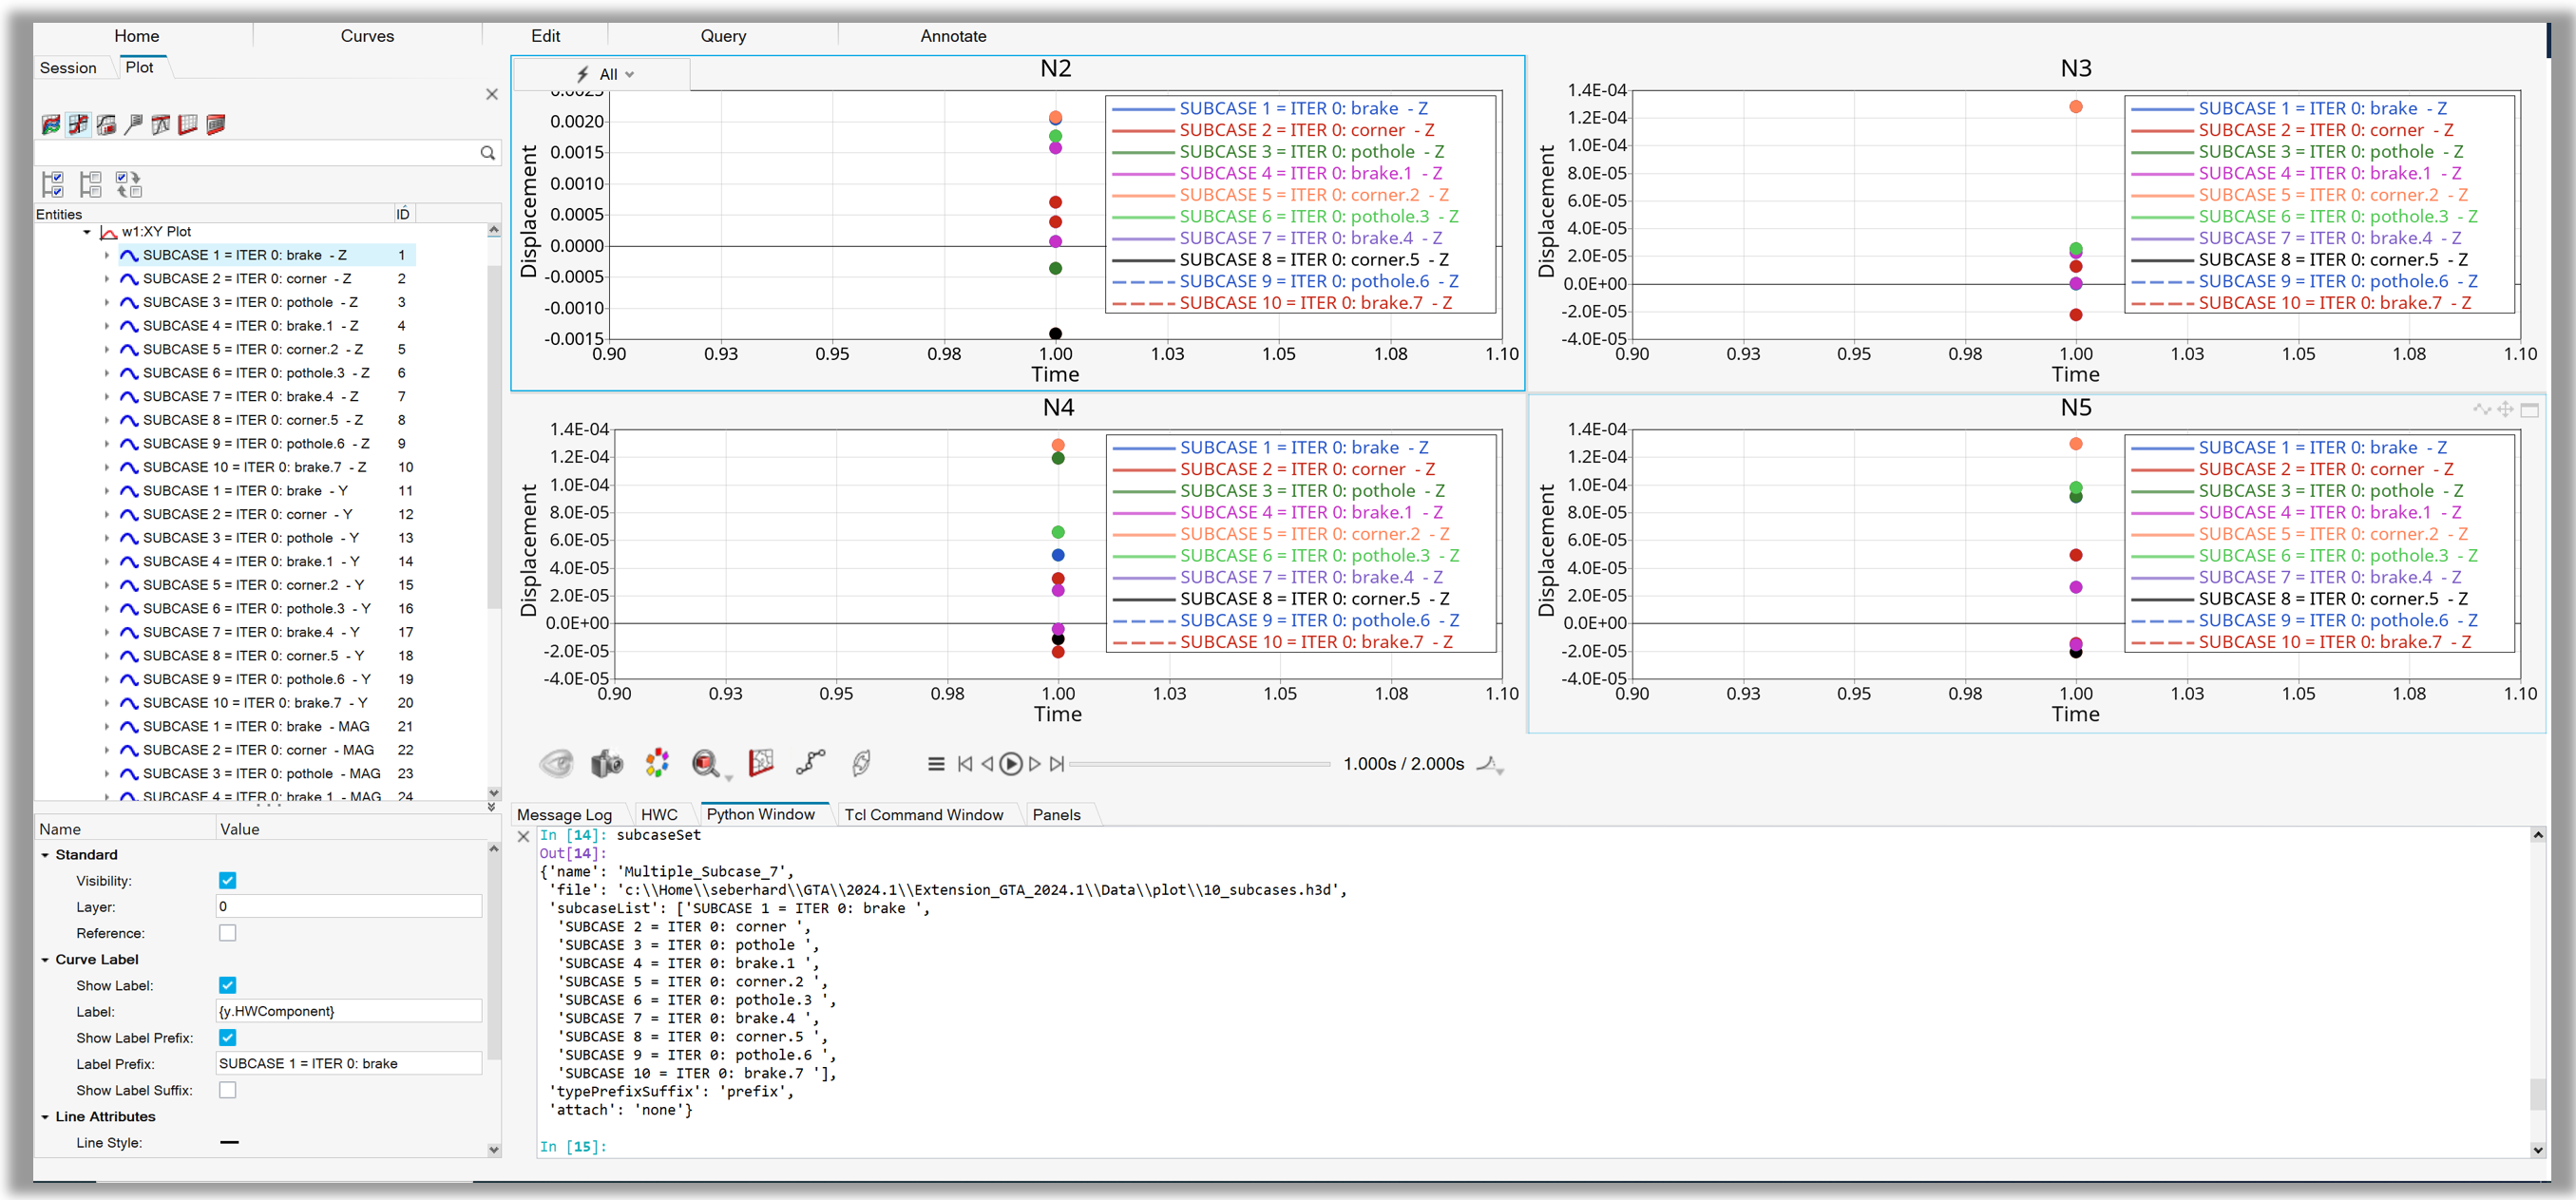
Figure 16. Plotting Curves from Multiple Subcases
Example 12 - Create XY Curve Plot Options#
 1    from hw import *
 2    from hw.hg import *
 3    import os
 4
 5    ALTAIR_HOME = os.path.abspath(os.environ['ALTAIR_HOME'])
 6    plotFile   = os.path.join(ALTAIR_HOME,'demos','mv_hv_hg','plotting','madymo','ANGACC')
 7
 8
 9    ses = Session()
10    ses.new()
11    win = ses.get(Window)
12
13    df=DataFile(plotFile)
14    subcaseList = df.getSubcaseLabels()
15    df=DataFile(plotFile)
16    dtl=df.getDataTypes()
17    dataType=dtl[1]
18
19    createCurvesOptions = CreateCurvesOptions('MyCurveOptions')
20
21    createCurvesOptions.pagePublishTitle=True
22    font=createCurvesOptions.pageFont
23    font.size=20
24    font.family='Arial'
25    createCurvesOptions.pageFont=font
26    createCurvesOptions.pageTitleScheme='custom'
27    createCurvesOptions.pageTitle='My Page'
28
29    createCurvesOptions.headerVisibility=True
30    createCurvesOptions.headerLabelScheme='custom'
31    createCurvesOptions.headerText='{y.HWRequest} - {y.HWComponent} modified'
32    createCurvesOptions.headerPrimaryFontSize=16
33    createCurvesOptions.headerAlignment='right'
34
35    createCurvesOptions.footerVisibility=True
36    createCurvesOptions.footerLabelScheme='custom'
37    createCurvesOptions.footerText='{y.HWRequest} - {y.HWComponent} modified'
38    createCurvesOptions.footerPrimaryFontSize=16
39    createCurvesOptions.footerAlignment='right'
40
41    createCurvesOptions.legendFontSize=8
42    createCurvesOptions.legendPlacement='insidelefttop'
43    createCurvesOptions.legendVisibility=True
44
45    createCurvesOptions.curveUseMath=True
46    createCurvesOptions.curveXexpression='u*5'
47    createCurvesOptions.curveYexpression='v*10'
48    createCurvesOptions.curveShowLabel=True
49    createCurvesOptions.curveLabelScheme='custom'
50    createCurvesOptions.curveLabel='{y.HWRequest} - edited - {y.HWComponent}'
51    createCurvesOptions.curveShowLabelPrefix=True
52    createCurvesOptions.curveLabelPrefix='START'
53    createCurvesOptions.curveShowLabelSuffix=True
54    createCurvesOptions.curveLabelSuffix='STOP'
55
56    createCurvesOptions.curveLineColorScheme='allOneColor'
57
58    col=Color(rgb=(0,255,0))
59    createCurvesOptions.curveLineColor=col
60    createCurvesOptions.curveLineThicknessScheme='allOneThickness'
61    createCurvesOptions.curveLineThickness=3
62    createCurvesOptions.curveLineStyleScheme='allOneStyle'
63    createCurvesOptions.curveLineStyle=4
64    createCurvesOptions.curveSymbolScheme='allOneSymbol'
65    createCurvesOptions.curveSymbol=5
66    createCurvesOptions.curveSymbolStyle=3
67    createCurvesOptions.curveSymbolColor=col
68    createCurvesOptions.curveSymbolFrequency=10
69
70    createCurvesOptions.curveXscale=3
71    createCurvesOptions.curveXoffset=1000
72
73    createCurvesOptions.curveYscale=7
74    createCurvesOptions.curveYoffset=5000
75
76    createCurvesOptions.curveStartIndex=10
77    createCurvesOptions.curveEndIndex=100
78    createCurvesOptions.curveIndexIncrement=10
79
80    # --------------------------------------------------
81
82    createCurves=CreateCurvesByFile()
83    createCurves.file = plotFile
84    createCurves.curveOptionsEnabled=True
85    createCurves.curveOptions=createCurvesOptions
86    createCurves.yDataType=dataType
87    createCurves.yRequest='all'
88    createCurves.yComponent='all'
89    createCurves.layoutType=1
90    createCurves.layoutOrganisation='onePlotPerRequest'
91
92    createCurves.run()
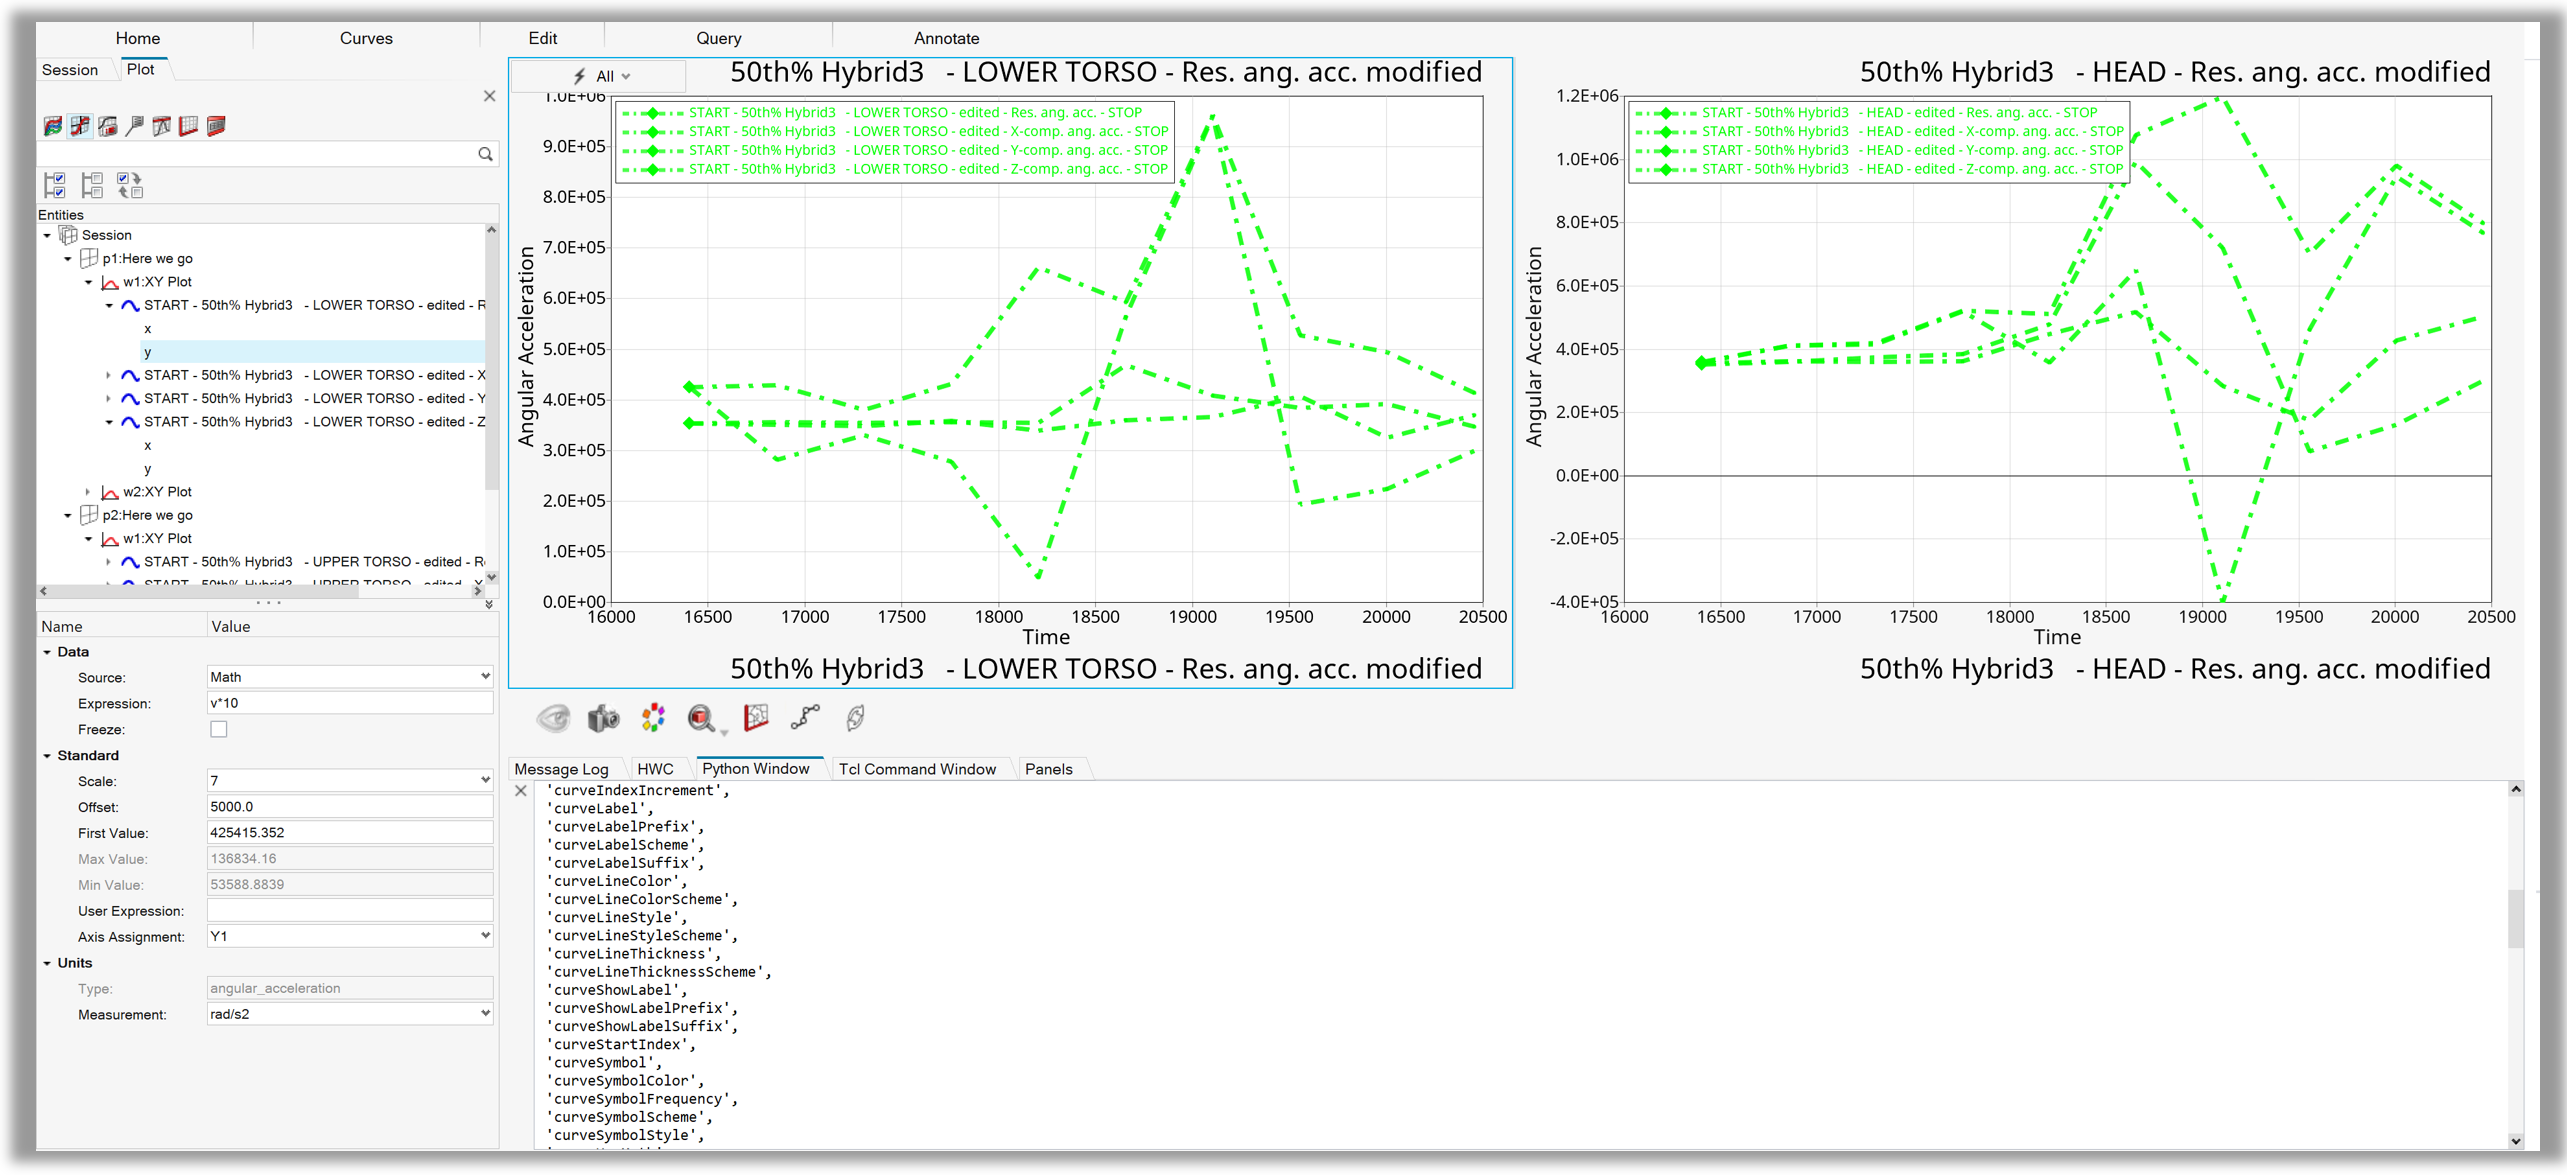
Figure 17. Plotting XY curvesw with modified Create Curves settings
Example 13 - Bar Charts#
 1    from hw import *
 2    from hw.hg import *
 3    import os
 4    import itertools
 5
 6    ALTAIR_HOME = os.path.abspath(os.environ['ALTAIR_HOME'])
 7    plotFile    = os.path.join(ALTAIR_HOME,'demos','mv_hv_hg','plotting','madymo','ANGACC')
 8
 9    ses = Session()
10    ses.new()
11    win = ses.get(Window)
12
13    win.type = 'bar'
14
15    win.barCategoryValues = ([*range(1,20)])
16    win.barSetCategoryValue(1,['A','B','C','D','E','F','G'])
17
18    win.barGap=10
19    win.barStyle='stack'
20    win.barCategoryLabelAngle='diagonal'
21    win.barLabelVisibility=True
22    win.barLabelFormat='fixed'
23    win.barLabelPrecision=0
24
25    # Layout and channel settings
26    colorList   = [(255,0,0),(0,0,255)]
27    requestList = ['50th% Hybrid3   - LOWER TORSO','50th% Hybrid3   - UPPER TORSO']
28    prefixList  = ['A','B']
29
30    # Loop over curves, notes and datums
31    for color,request,pf in  zip(colorList,requestList,prefixList):
32
33            bar=CurveBar(   yFile=plotFile,
34                            ySource='file',
35                            yDataType= 'Angular Acceleration',
36                            yRequest= request,
37                            yComponent= 'Res. ang. acc.',
38                            lineColor=color,
39                            label=request,
40                            showPrefix = True,
41                            prefix = pf,
42                            yOffset=20)
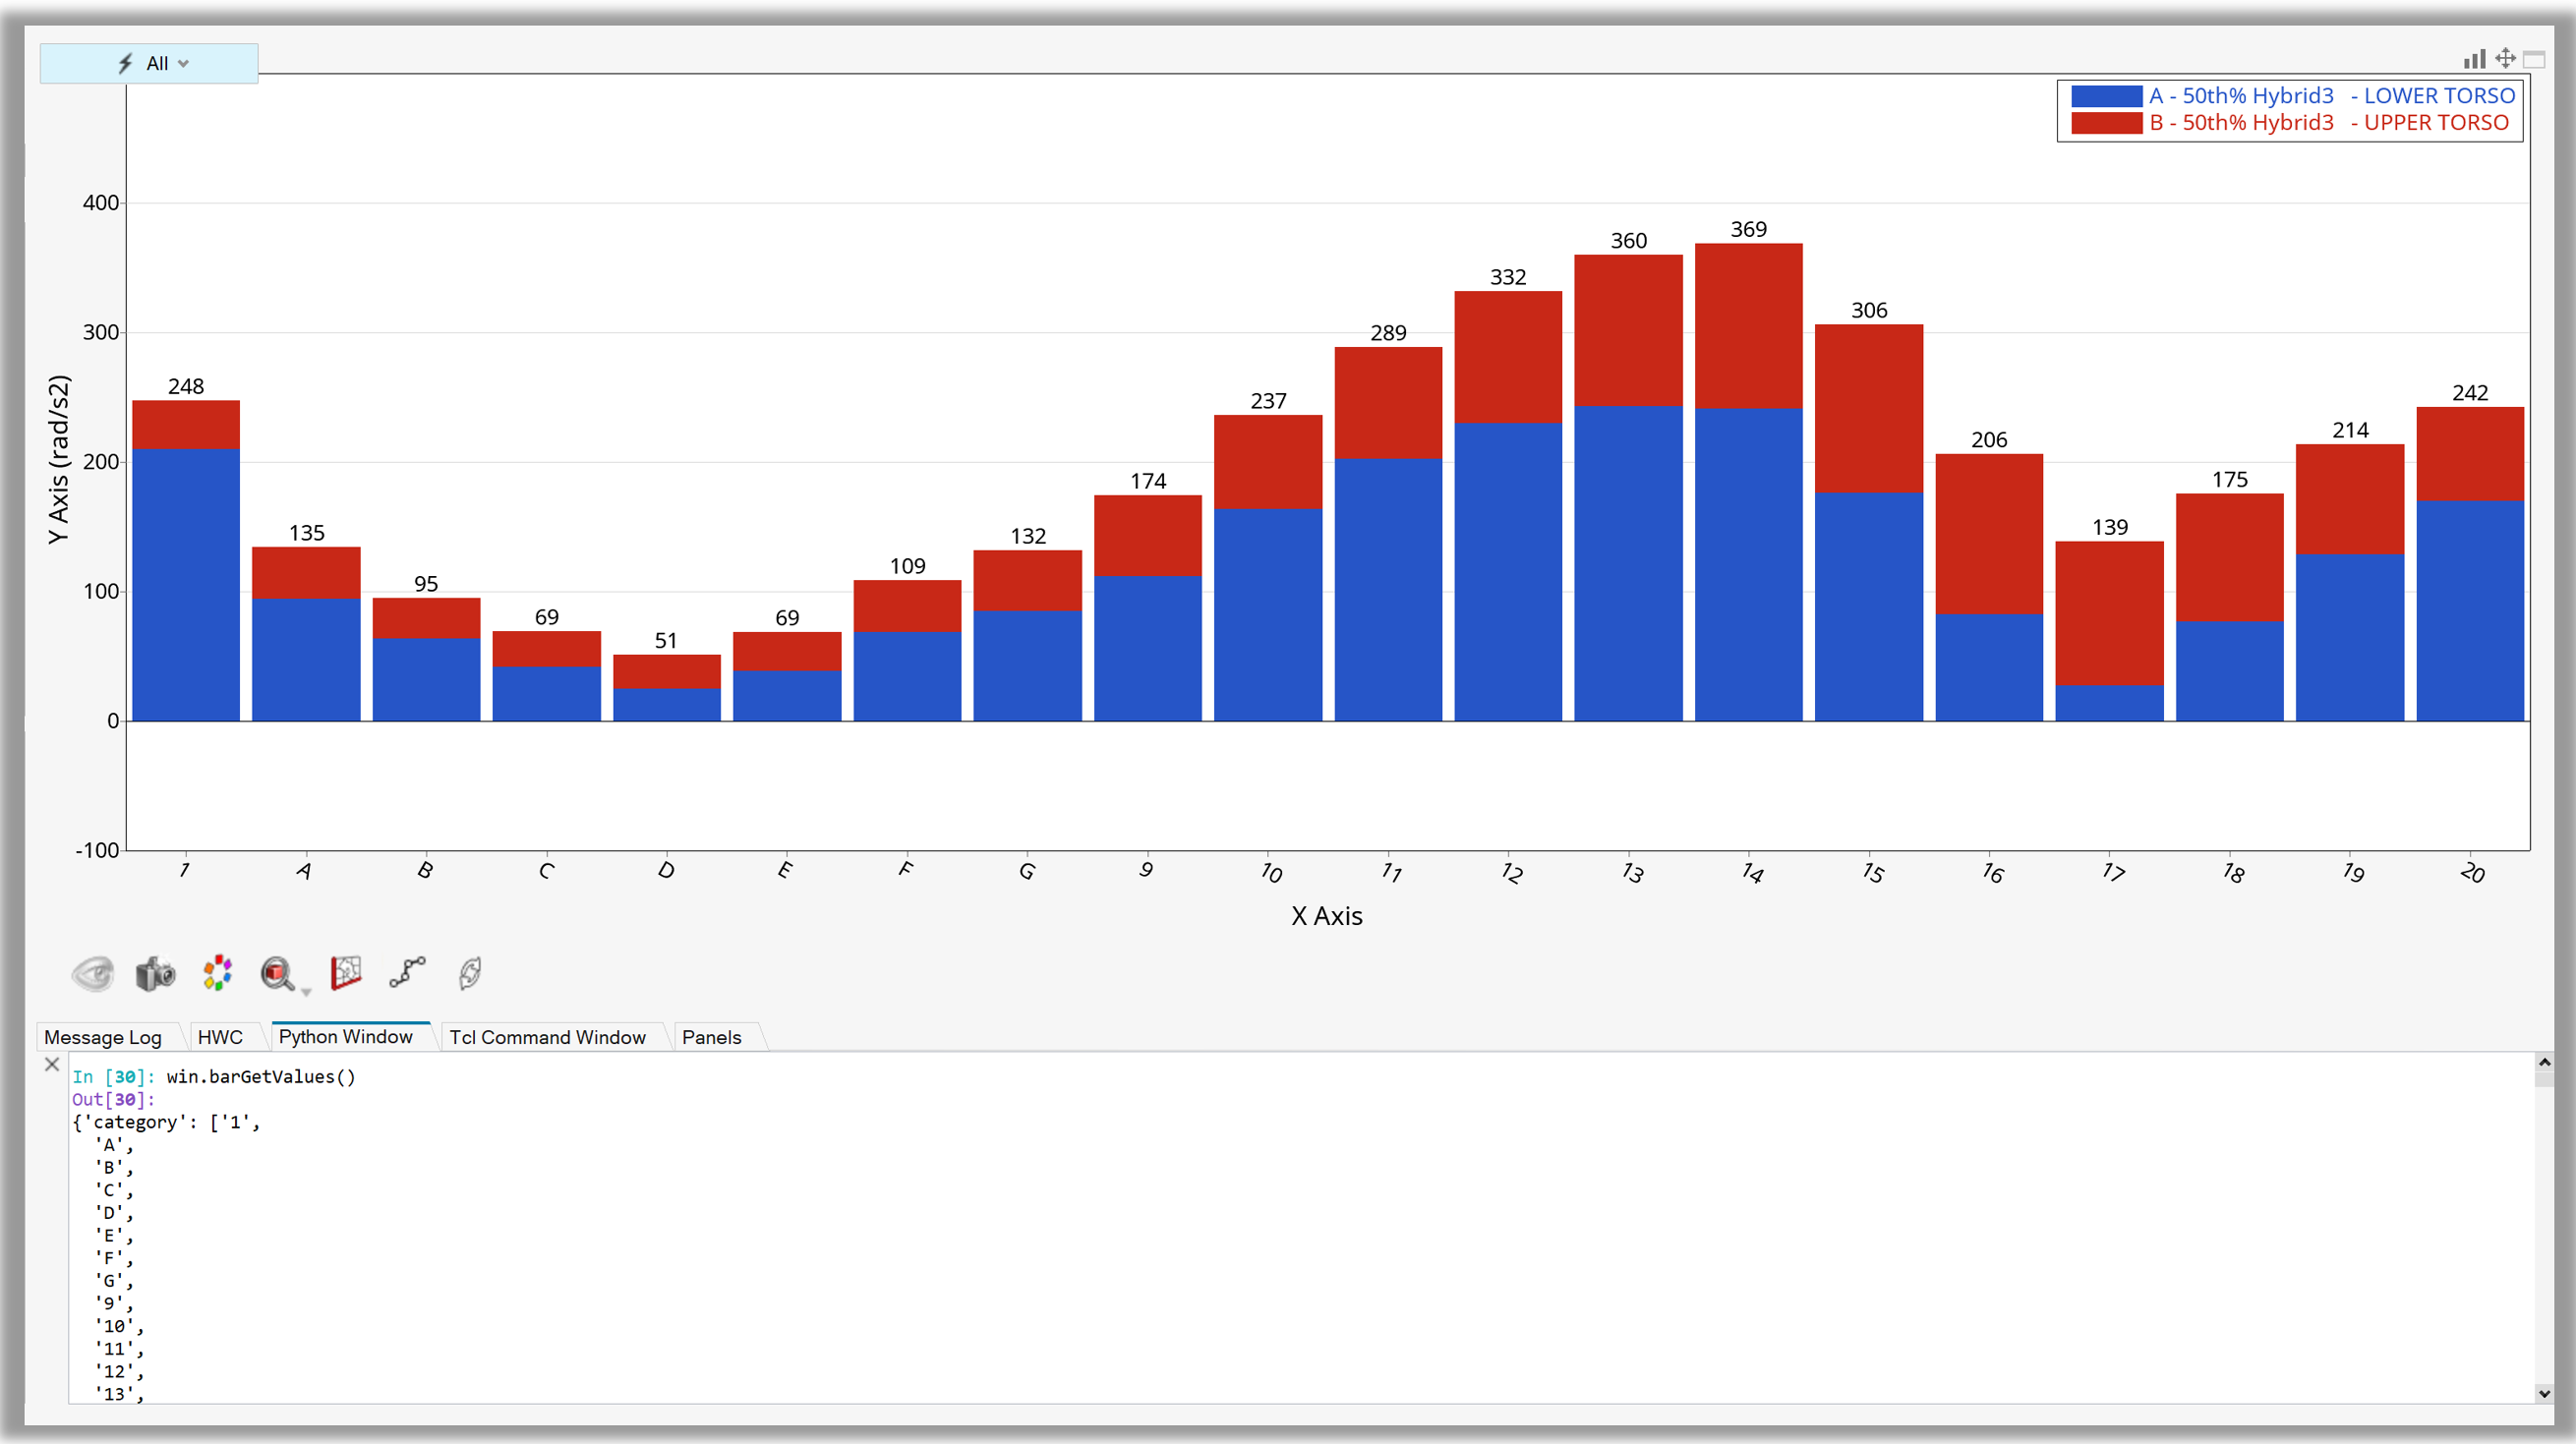
Figure 17. Creating bar charts from file
Example 14 - Create multiple Complex Plots#
 1    from hw import *
 2    from hw.hg import *
 3    import os
 4
 5    scriptDir = os.path.abspath(os.path.dirname(__file__))
 6    plotFile = os.path.join(scriptDir,'..','Data','plot','control_arm_sol111.pch').replace("\\","/")
 7
 8    ses  = Session()
 9    ses.new()
10    win=ses.get(Window)
11
12    dtIndex=1
13    dataFile=DataFile(plotFile)
14    scl=dataFile.getSubcaseLabels()
15    dtl=dataFile.getDataTypes()
16    rl=dataFile.getRequests(dtl[dtIndex])
17
18    cl=dataFile.getComponents(dtl[dtIndex],format='complex')
19    dt=dtl[1]
20    sc=scl[0]
21
22    win.type="complex"
23    createCurves = CreateCurvesByFile()
24    createCurves.file = plotFile
25    createCurves.chartType='complex'
26    createCurves.subcase=sc
27    createCurves.yDataType=dt
28    createCurves.yRequest=rl
29    createCurves.yComponent=cl[2:]
30    createCurves.layoutType=7
31    createCurves.layoutOrganisation='onePlotPerComponent'
32    print('Component List = ' + str(createCurves.yComponent))
33
34    createCurves.run()
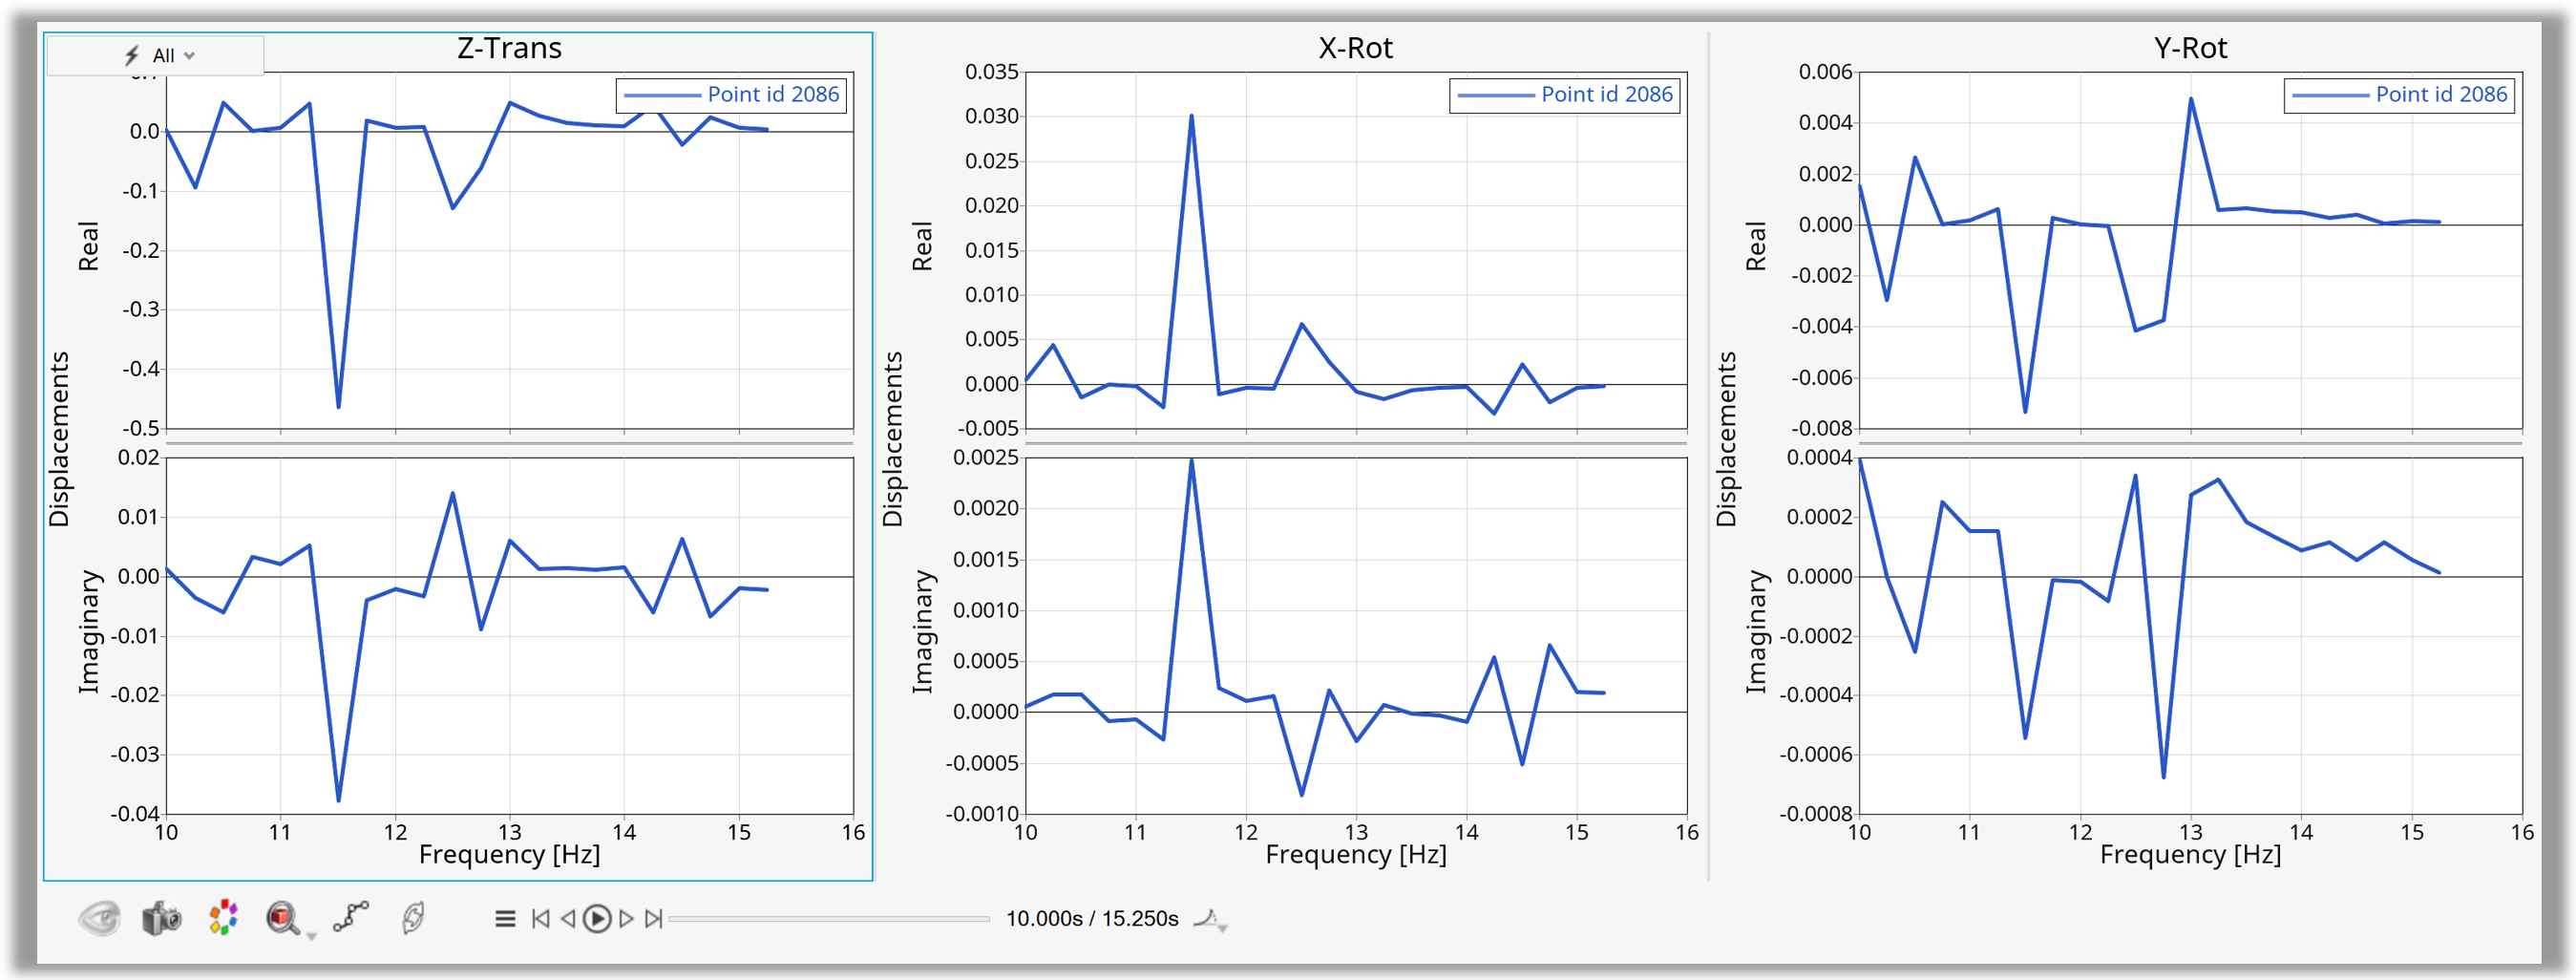
Figure 18. Create multiple complex plots in a predefined layout
Example 15 - Create multiple Polar Plots#
 1    from hw import *
 2    from hw.hg import *
 3    import os
 4
 5    scriptDir = os.path.abspath(os.path.dirname(__file__))
 6    plotFile = os.path.join(scriptDir,'..','Data','plot','control_arm_sol111.pch').replace("\\","/")
 7
 8    ses  = Session()
 9    ses.new()
10    win=ses.get(Window)
11
12    dtIndex=1
13    dataFile=DataFile(plotFile)
14    scl=dataFile.getSubcaseLabels()
15    dtl=dataFile.getDataTypes()
16    rl=dataFile.getRequests(dtl[dtIndex])
17
18    cl=dataFile.getComponents(dtl[dtIndex],format='polar')
19    dt=dtl[1]
20    sc=scl[0]
21
22    createCurves = CreateCurvesByFile()
23    createCurves.file = plotFile
24    createCurves.chartType = 'polar'
25    createCurves.subcase = sc
26    createCurves.yDataType = dt
27    createCurves.yRequest = rl
28    createCurves.yComponent = 'all'
29    createCurves.layoutType = 7
30    createCurves.layoutOrganisation = 'onePlotPerComponent'
31    print('Component List = ' + str(createCurves.yComponent))
32
33    createCurves.run()
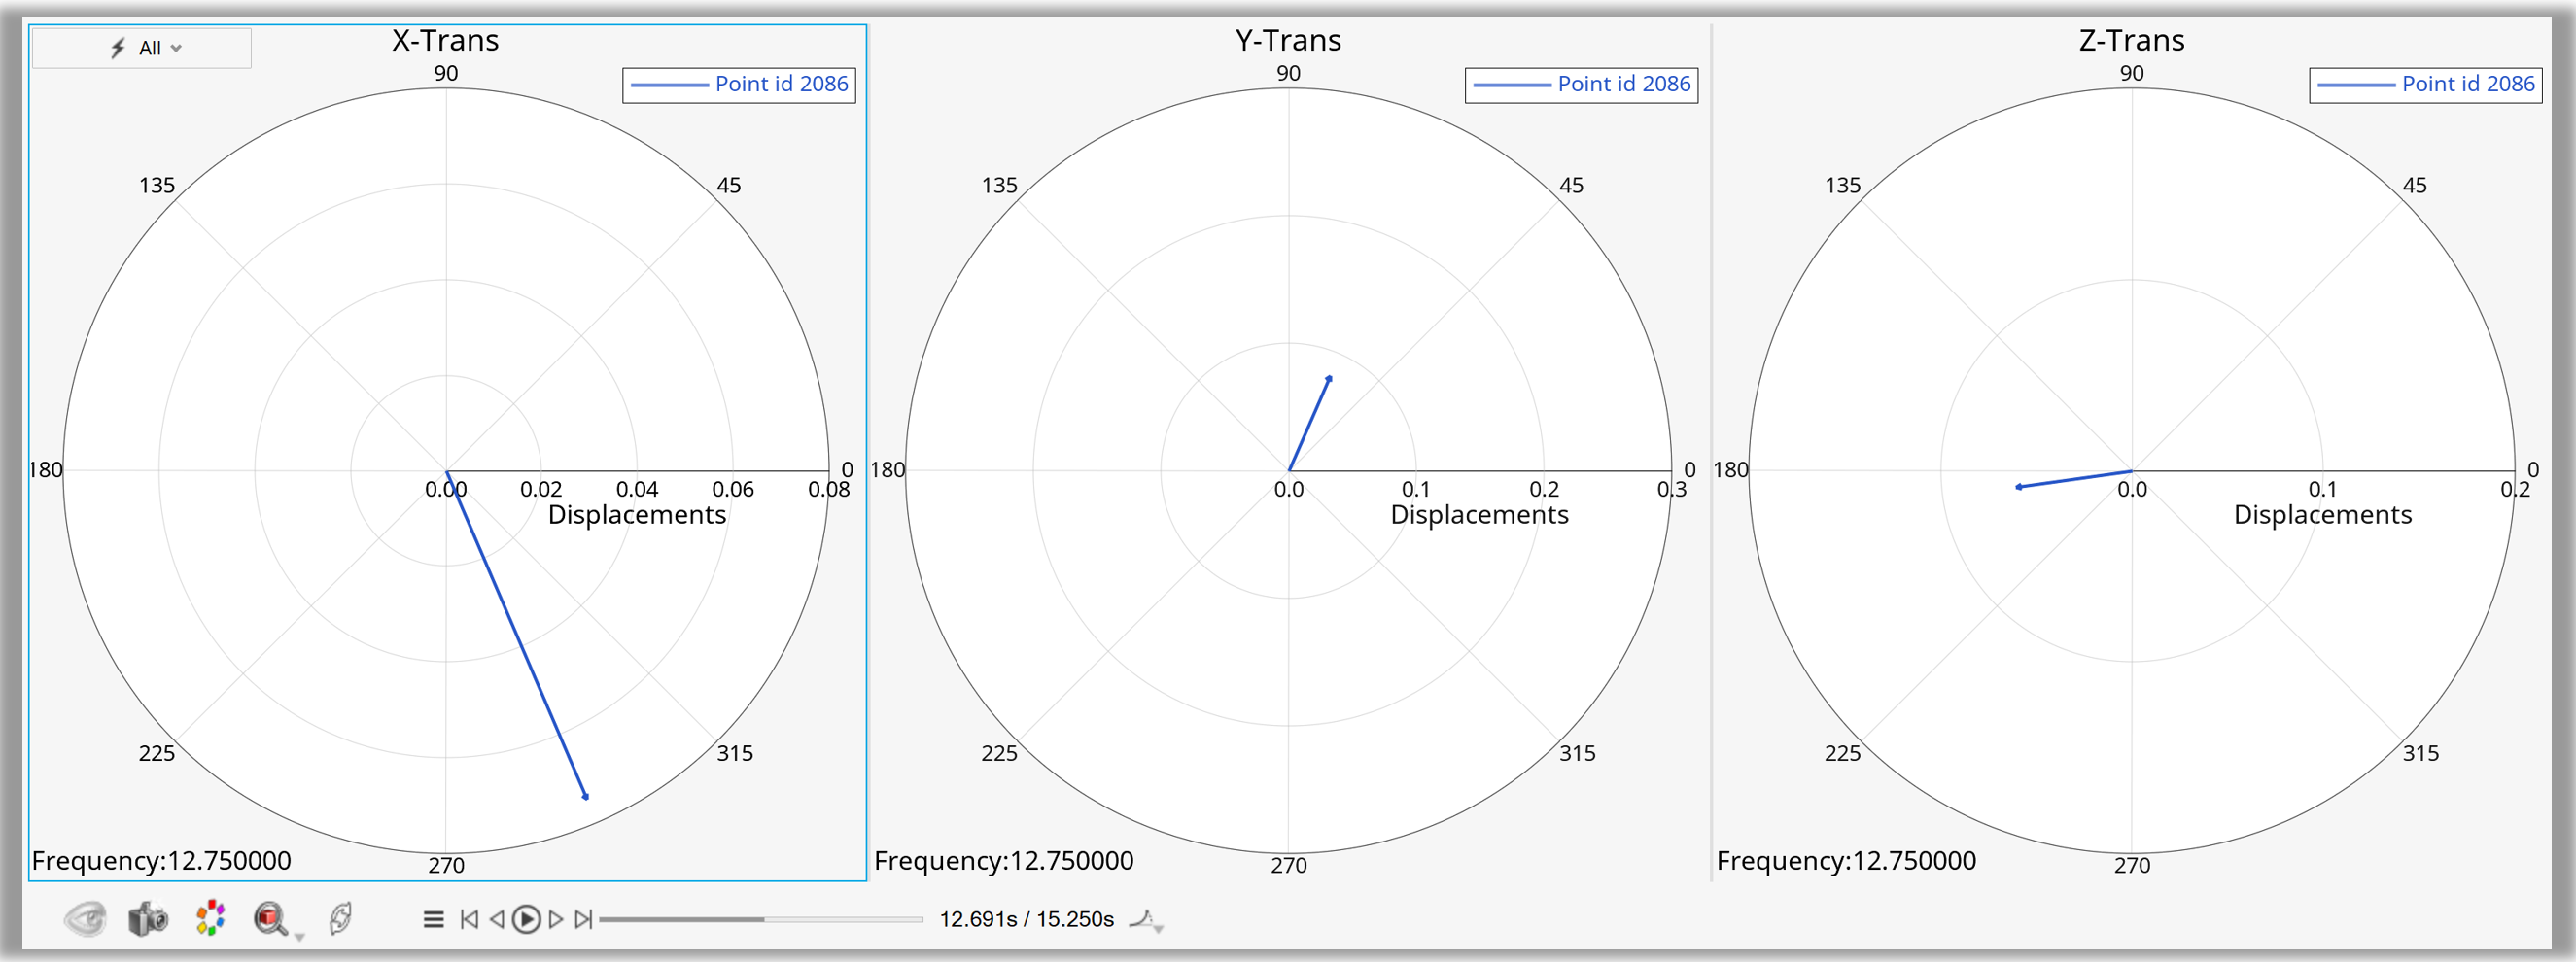
Figure 19. Create multiple polar plots in a predefined layout