This tutorial guides you through a step-by-step process that covers all the major
functionalities ofHyperLife Crack Growth. By working through the tutorial,
you can quickly learn the tool and start using HyperLife Crack Growth to
evaluate the Crack Growth problem.
Before you begin, copy the file(s) used in this tutorial to your
working directory.
From the Home tools, Files tool group, click the Open Model tool.
Figure 1. The Open Model/Results Files dialog
opens.
Browse for and select HL-3000\Fillet.fem as the model
file.
Browse for and select HL-3000\Fillet.h3d as the result
file.
Click Apply.
Figure 2.
Assign Materials
Create Material with Strain Life and Crack Growth – Total Life
properties.
Click the Material tool.
Figure 3.
The Assign Material dialog opens.
Activate the checkbox next to the part Base and
Fillet.
Click the My Material tab.
Click .
A new material named Mat_EN("n") is created.
Set the Elastic Modulus to 155000.
Set the Standard Error of Log(elastic strain) (SEe) to
0.0.
Set the Standard Error of Log(plastic strain) (SEp) to
0.0.
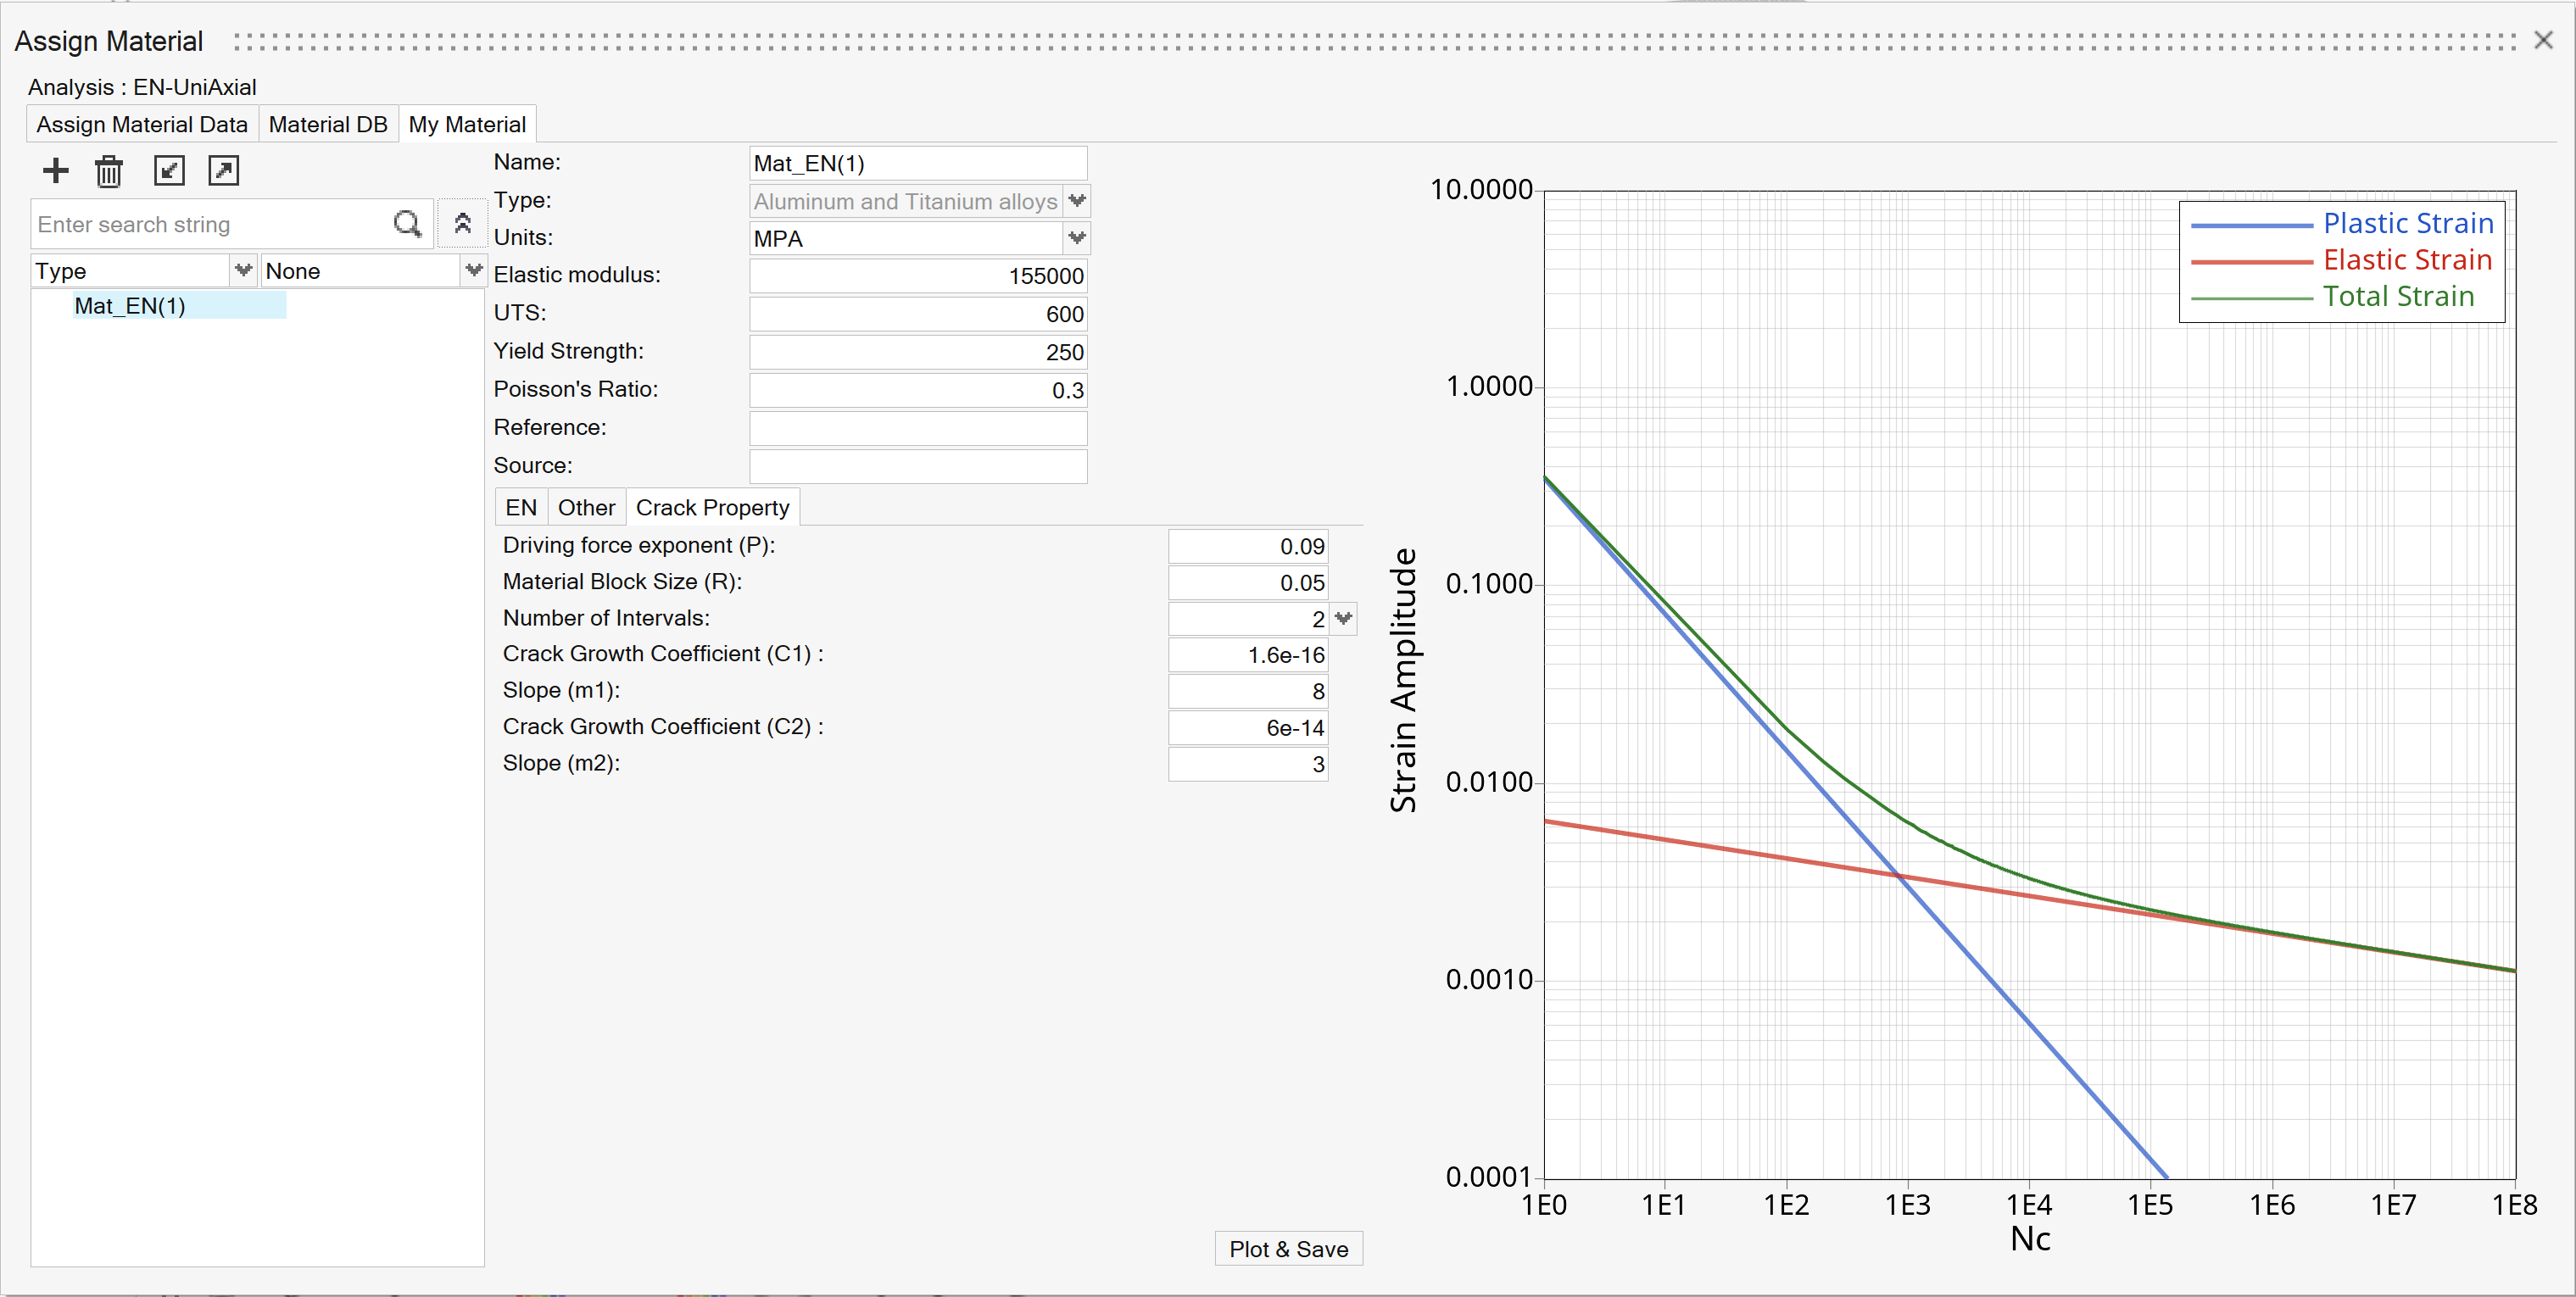
Switch to Crack Properties and review the default
properties.
Click Plot & Save.
Figure 4.
Figure 5.
Right-click on the newly created material and select Add to Assign
Material List.
Click the Assign Material Data tab.
For Base and Fillet, select
Mat_EN("n") from the Material drop-down menu.
Accept the default parameters in the Assign Material Data
tab.
Figure 6.
Exit the dialog.
Assign Load Histories
Create required event combine load history channel and FE subcases.
Click the Load Map tool.
Figure 7.
The Load Map dialog opens.
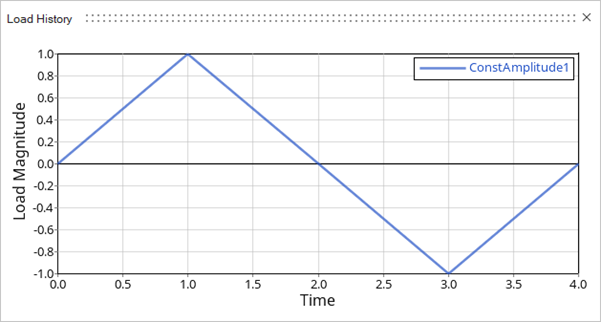
From the Channel Type drop-down menu at the top of the
dialog, select Constant Amplitude.
Click
to add the load case.
Click to view a plot of the load. Tip: Expand the width
of the dialog to view a clearer picture of the plot.
Figure 8.
Tip: Expand the width of the dialog to view a
clearer picture of the plot.
On the bottom half of the dialog, verify Auto is
selected for event creation.
Select Subcase 1 and the Constant Amplitude load, then
click
to create an event.
Event_1 is created with Configuration, select
Superposition.
Set Scale to 100.
Activate the Event_1 checkbox.
Figure 9.
Exit the dialog.
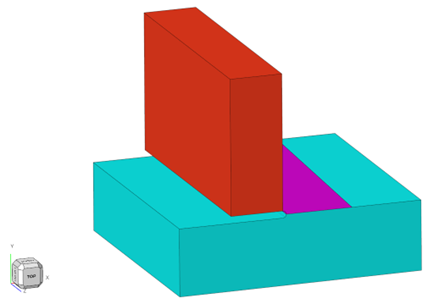
Define a Hotspot
Defining a Hotspot to which Crack Properties are assigned.
Click the Hotspot tool.
Figure 10.
The Hotspot guidebar opens.Figure 11.
Click on the left icon to open the Hotspot creation options.
Figure 12.
Creation option is set to Manual.Figure 13.
Note: Custom Config file allows user to creating a
hotspot at required node and create-assign a system to define the crack
direction. The feature requires a configuration file
(.txt) linked to a .csv
file containing nodal information for system creation using 3
nodes.
Click on Nodes and select node by ID: 1814 and click on
the button to create hotspot at selected node.
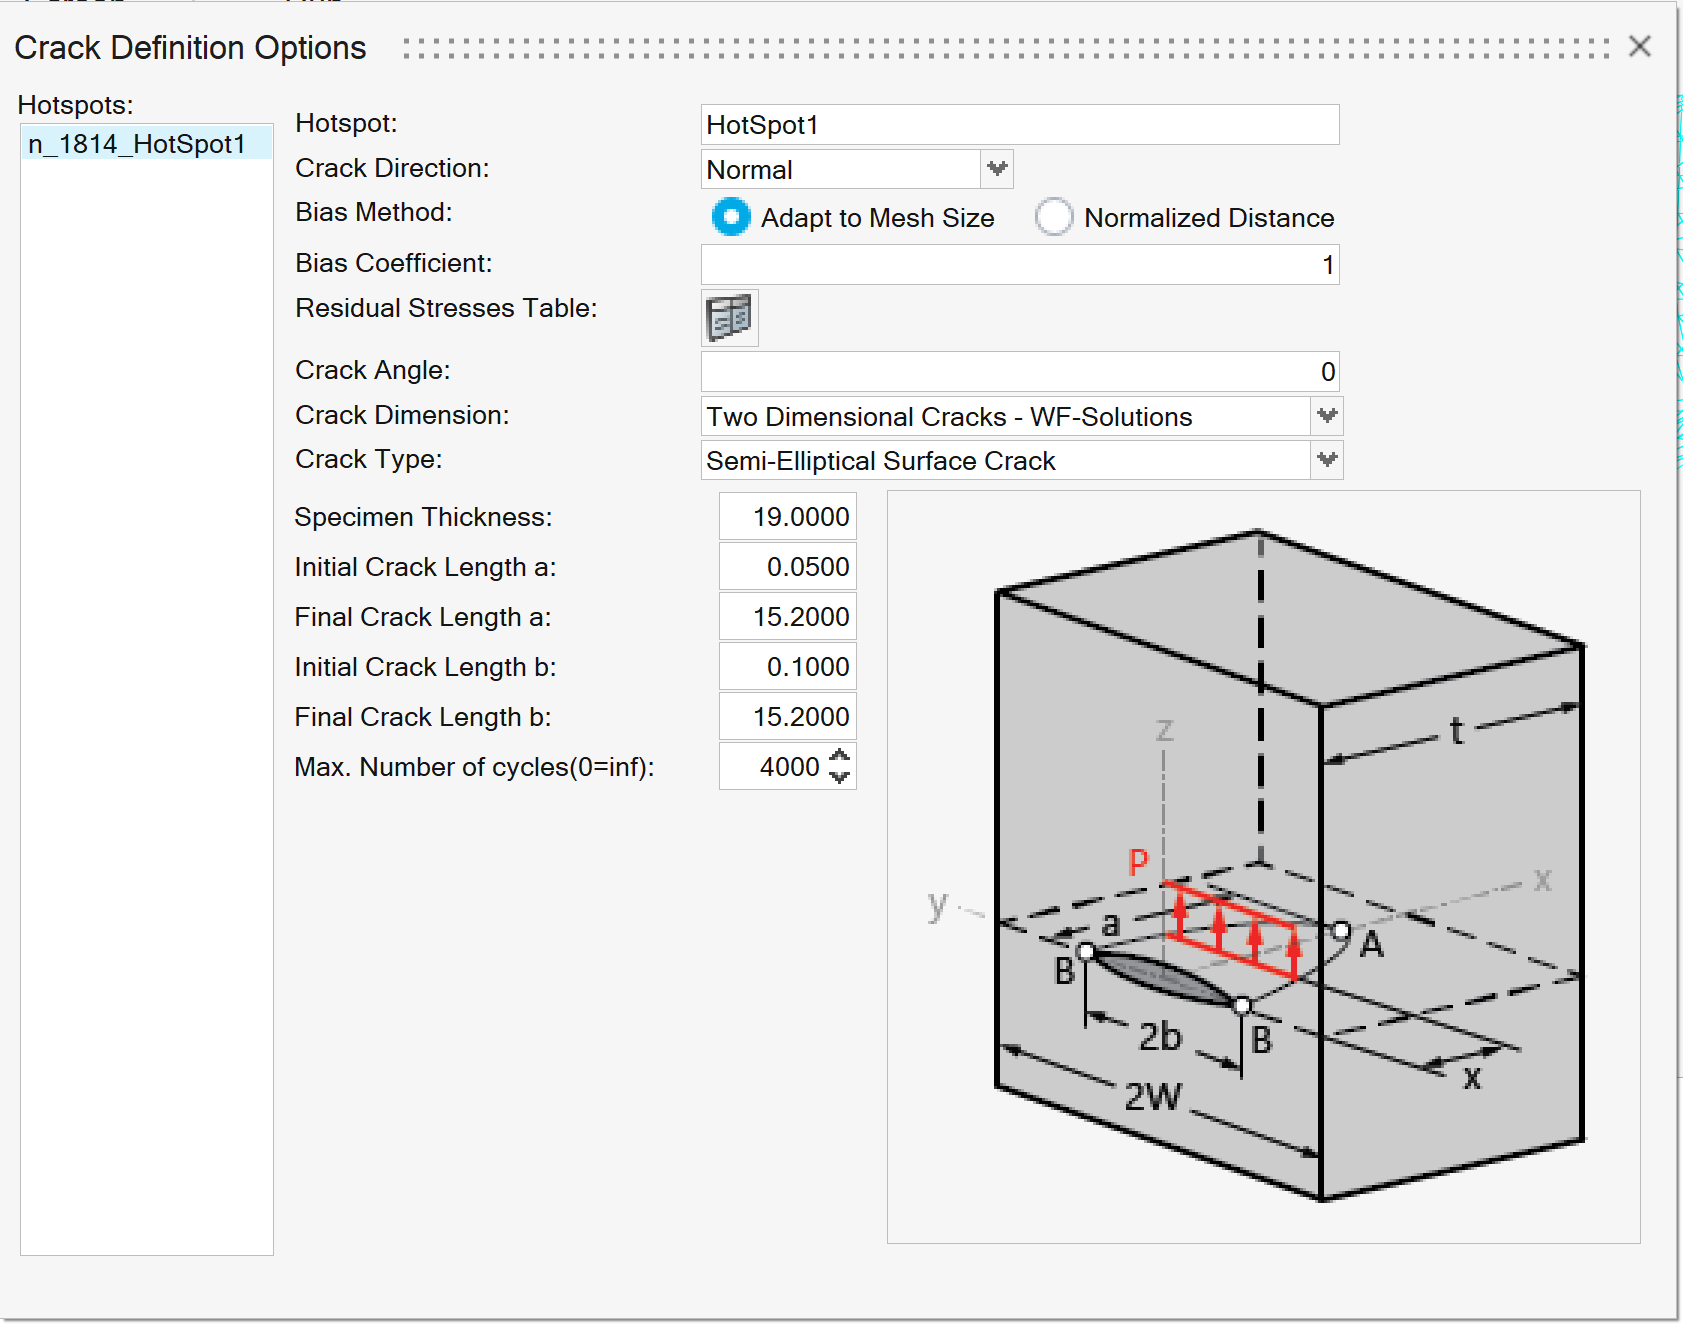
Open Crack definition options by pressing the button.
Figure 14. Figure 15.
Set Crack Direction to
Normal.
Note:
System defining the crack direction can be created and assigned
to the hotspot.
From the created system: Z-axis represent the crack direction and
XZ-plane represents the Stress distribution direction.
Set Bias Method to Adapt to Mesh
Size.
Adapt to Mesh Size extracts stress in elements bisecting the crack
direction. Biasing Coefficient defines the number of points from each
element in the crack direction.
Residual table and Crack
Angle are not applied.
Crack Angle allows rotation of the XZ plane for
stress distribution direction.
Crack dimension and Crack
type are set to Two Dimensional Crack – WF
solutions and Semi-Elliptical surface
Crack.
The following crack dimensions are updated.
Specimen thickness: 19.0
Initial Crack length: 0.05
Final Crack Length a: 15.2
Initial Crack Length b: 0.1
Final Crack Length b: 15.2
Max no. of cycles (0=inf): 100000000
Exit the dialog.
Evaluate and View Results
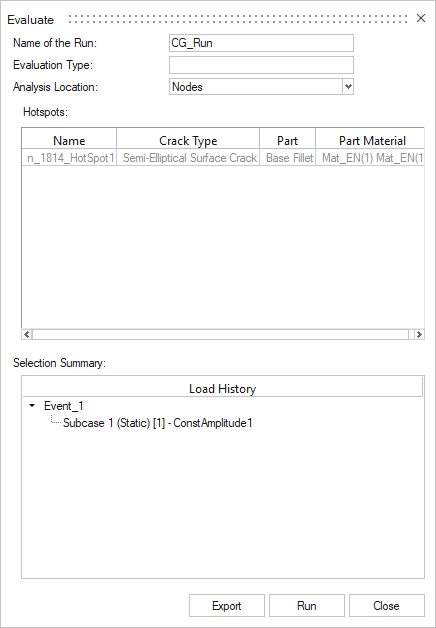
From the Evaluate tool group, click the Run Analysis tool.
The Evaluate dialog opens.Figure 16.
Enter a name for the run.
Click Run.
Result files are saved to the home directory and the Run progress bar
appears in the status bar.
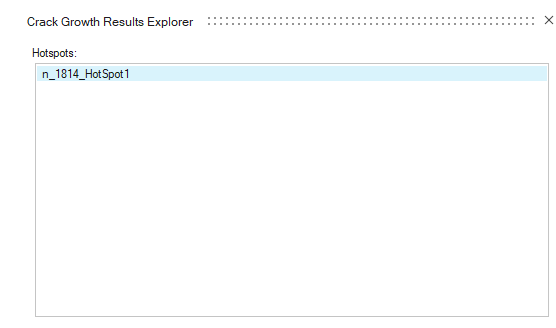
Once the run is complete, click the Evaluate icon.
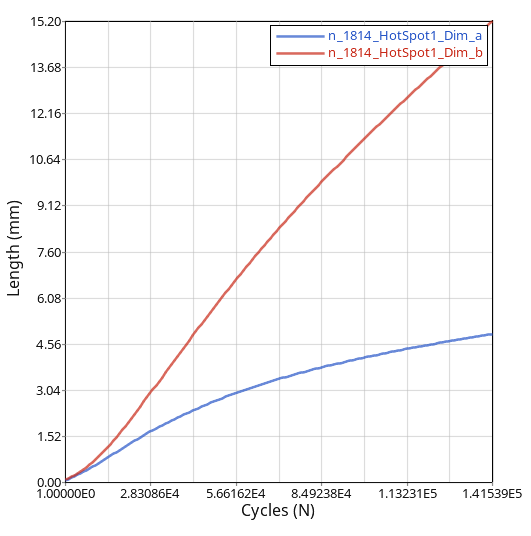
Use the Results Explorer to select the hotspot and review its rate of crack
growth.
Figure 17. Figure 18.
Review the working directory for:
Log file: CG_Run.log: highlights the run
summary
Stress Distribution file:
n_1814_HotSpot1_Event1_Fatload1.txt

 The Assign Material dialog opens.
 .
A new material named Mat_EN("n") is created.
.
A new material named Mat_EN("n") is created.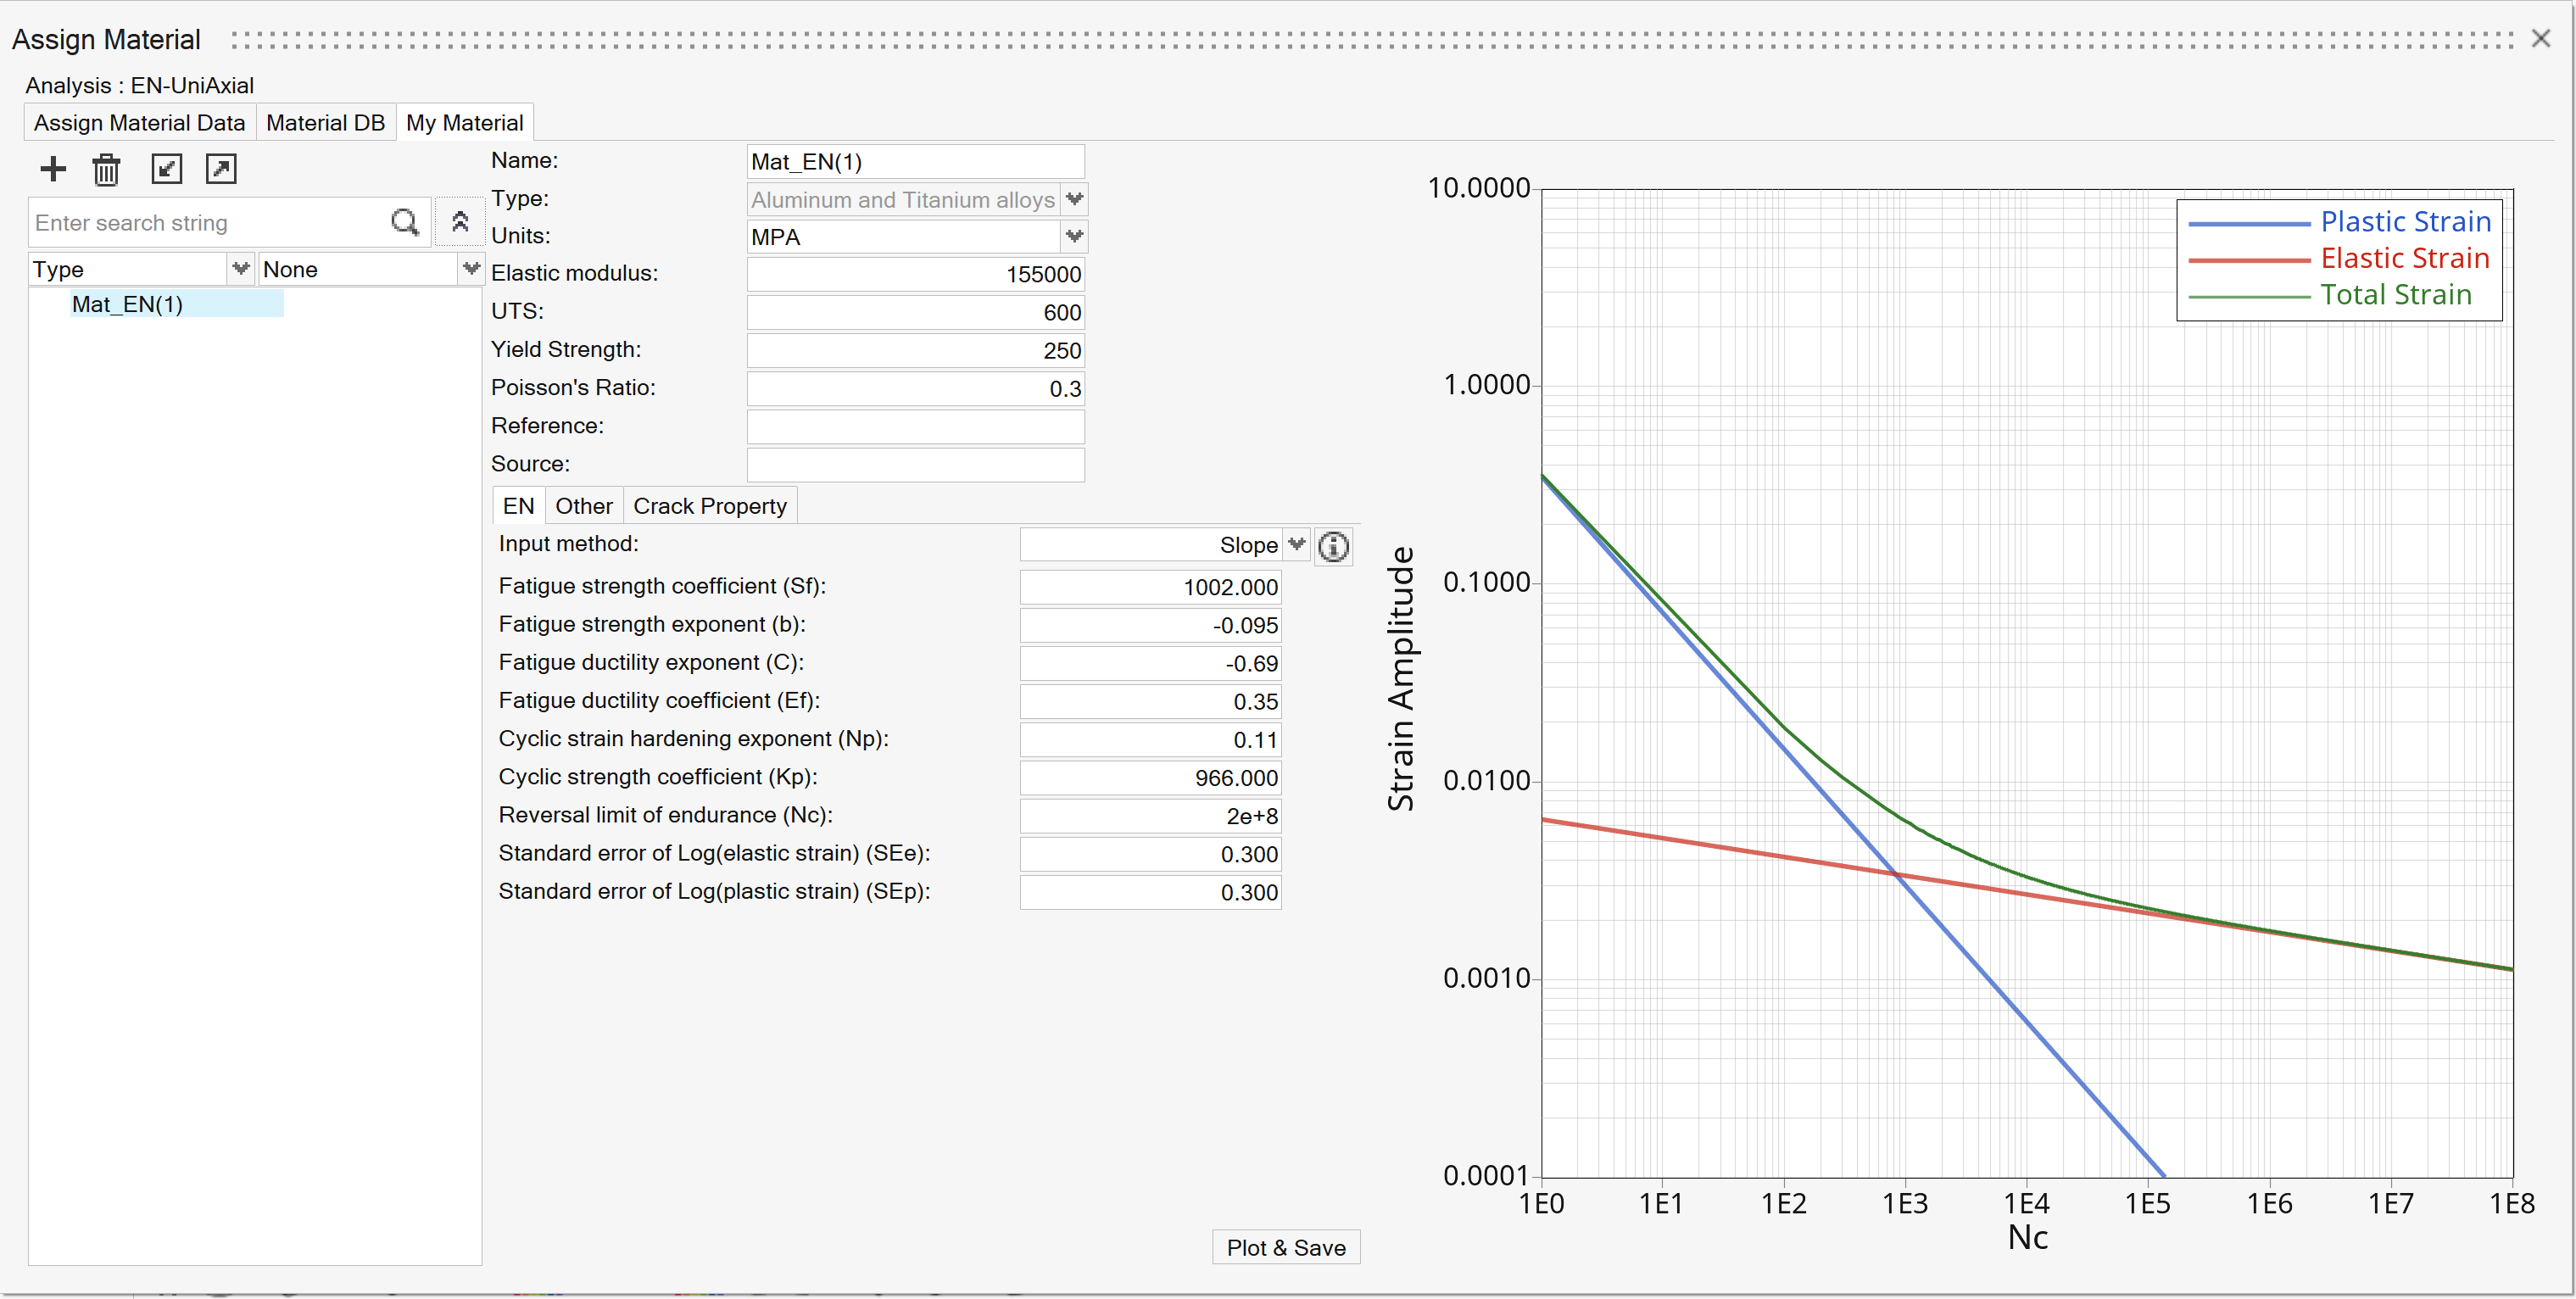

 The Load Map dialog opens.
 to view a plot of the load. Tip: Expand the width
of the dialog to view a clearer picture of the plot.
to view a plot of the load. Tip: Expand the width
of the dialog to view a clearer picture of the plot.
 Tip: Expand the width of the dialog to view a clearer picture of the plot.
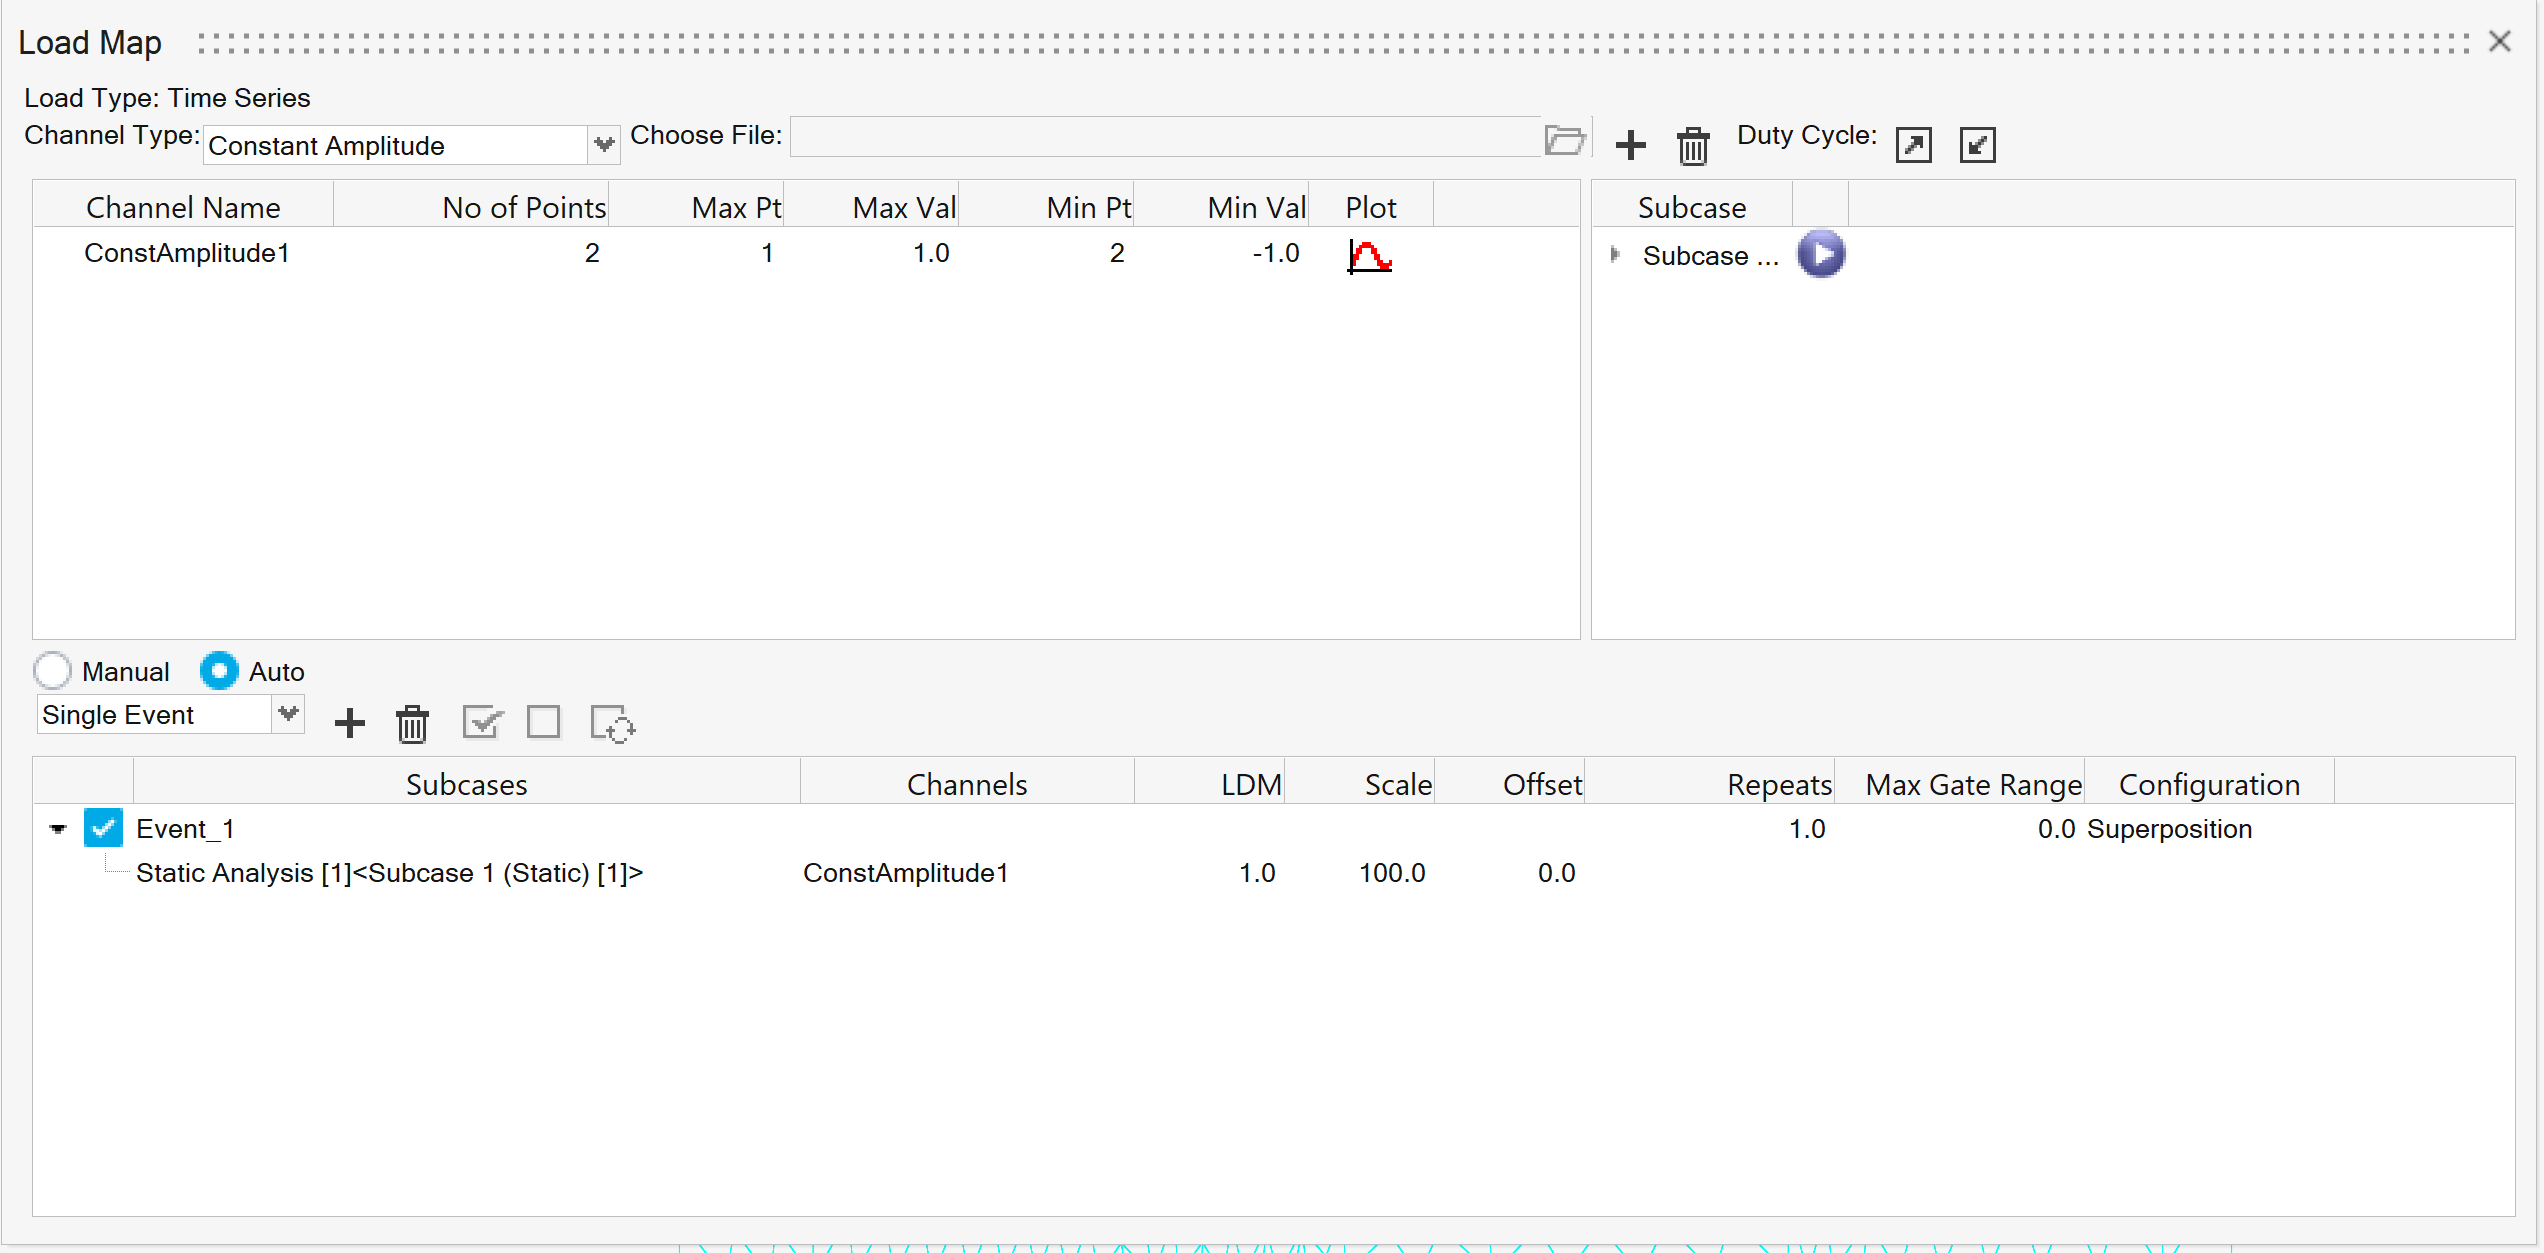
 The Hotspot guidebar opens.
 icon to open the Hotspot creation options.
 Creation option is set to Manual.
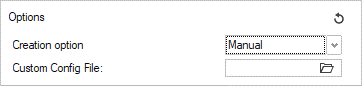 Note: Custom Config file allows user to creating a hotspot at required node and create-assign a system to define the crack direction. The feature requires a configuration file (.txt) linked to a .csv file containing nodal information for system creation using 3 nodes.
 button to create hotspot at selected node.
 button.