Identify design errors in the Residuals post processing tab.
From the Post Processing step, click the Residuals
tab.
From the Channel selector, select one output and one or more inputs to
investigate.
Optional: Switch the view from residuals table to residuals plot by clicking , located next to the Channel selector.
Note: The plot shows the residuals versus the original output response. This
plot is useful to visually assess the performance of a Fit. It is desirable to not have any visual pattern
to the residuals; unbiased and homoscedatic residuals appear similar to
randomness.
Click (located above the Matrix Residuals
table) to select the type of residuals displayed in the table.
By default, Input Matrix residuals are displayed.
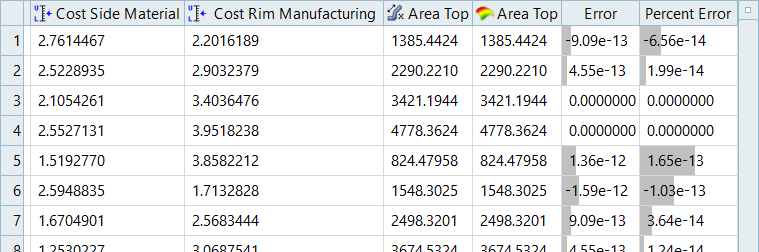
The error (and percentage) between the original output response and the approximation
is listed for each run of the Input, Cross-Validation, or Testing matrices.
CAUTION:
View the Percent Error column with caution when the values of the output
response approach zero. In this situation, the Percent Error can be very
high and potentially misleading.
Figure 1. Cross-Validation Matrix Residuals
Tip: Search for specific cases using
the Find and Sort options, which can be accessed from the context menu that opens
when you right-click in the work area.
Configure the Residuals tab display
settings by clicking (located
in the top, right corner of the work area). For more information about these settings,
refer to Residuals Tab Settings.
Residuals Tab Settings
Settings to configure the results displayed in the Residuals post processing
tab.
Access settings from the menu that displays when you click (located above the Matrix Residuals
table).

 , located next to the Channel selector.
Note: The plot shows the residuals versus the original output response. This plot is useful to visually assess the performance of a Fit. It is desirable to not have any visual pattern to the residuals; unbiased and homoscedatic residuals appear similar to randomness.
, located next to the Channel selector.
Note: The plot shows the residuals versus the original output response. This plot is useful to visually assess the performance of a Fit. It is desirable to not have any visual pattern to the residuals; unbiased and homoscedatic residuals appear similar to randomness. (located above the Matrix Residuals
table) to select the type of residuals displayed in the table.
By default, Input Matrix residuals are displayed.
(located above the Matrix Residuals
table) to select the type of residuals displayed in the table.
By default, Input Matrix residuals are displayed.