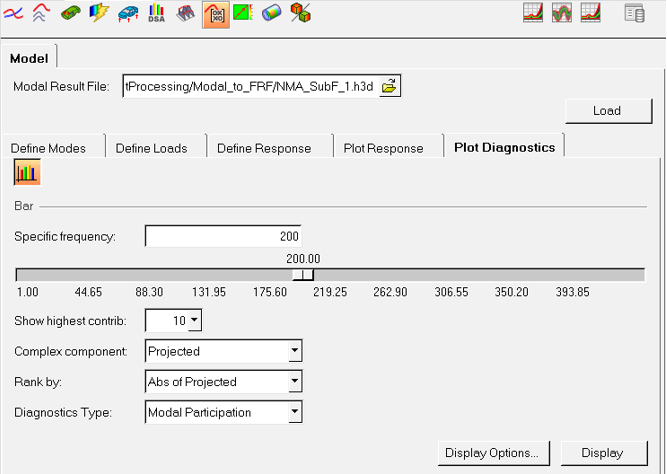
Creates a bar plot of the diagnostic results at a specific
frequency.
Enter a specific frequency in the Specific frequency field, or use the
slider bar to select a frequency value. When you use the slider bar to
select a frequency, a red line is displayed on the response plot and is
dragged simultaneously as you drag the slider bar.
Show highest contrib
Select the highest number of contributors to display.
Diagnostic Type
Select the diagnostic results calculated from the modal results.
Display Options
The Display Options dialog allows you to further customize the
plot.
Display
Click Display to create and display the
plot.
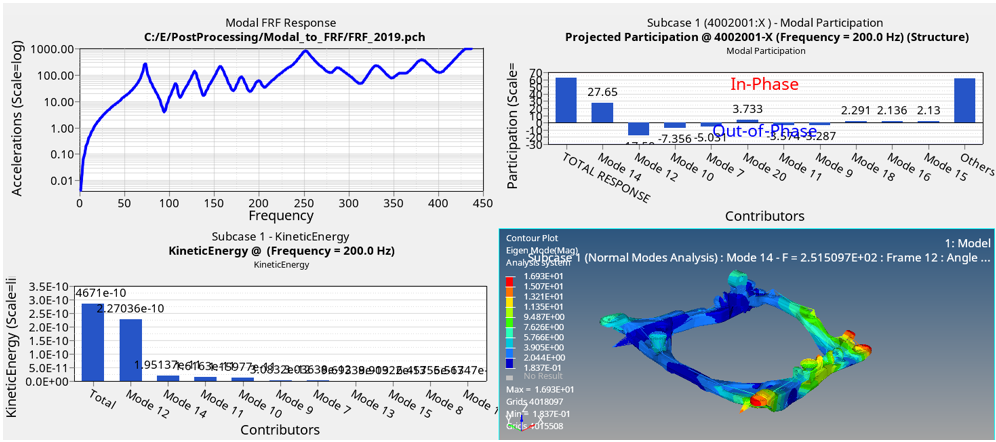
The following image illustrates Modal contributions and kinetic energy contribution
for Modal based response at the selected concerned frequency and Modal animation for
the selected mode from modal contribution bar chart.Figure 1.