
OS-V: 0800 Hyperelastic Material Verification
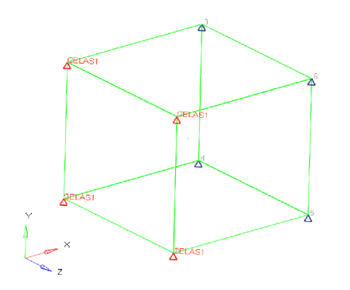
Examines the hyperelastic behavior of a hexahedral element under enforced displacement using different material models such as Arruda Boyce, reduced polynomial, Yeoh and Ogden model.
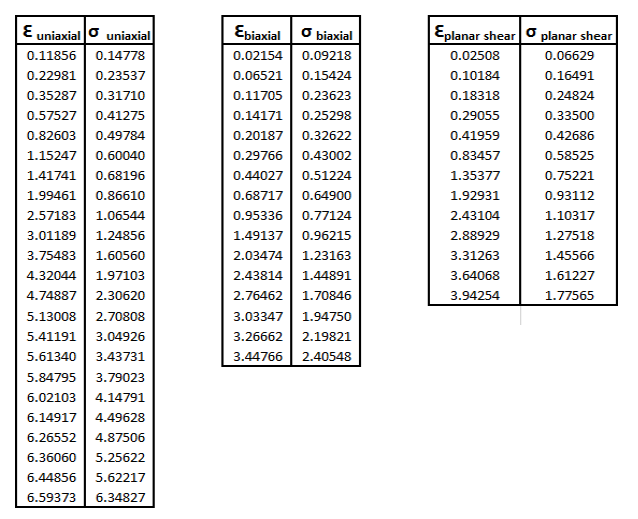
In 1944, L.G.R. Treloar 1 performed experiments on 8% rubber to obtain the uniaxial stress-strain curve which has been digitized and utilized for this simulation.
Model Files
Benchmark Model
Units: mm, s, Mg, N, MPa
Material
- Field
- Model
- Identifies material model
- NU (Poisson's Ratio)
- Both 0.4997 and 0.495 values can be used
- TAB1
- Defines the Uniaxial tension-compression data
- TAB2
- Defines Equi-biaxial data
- TAB4
- Defines Shear data
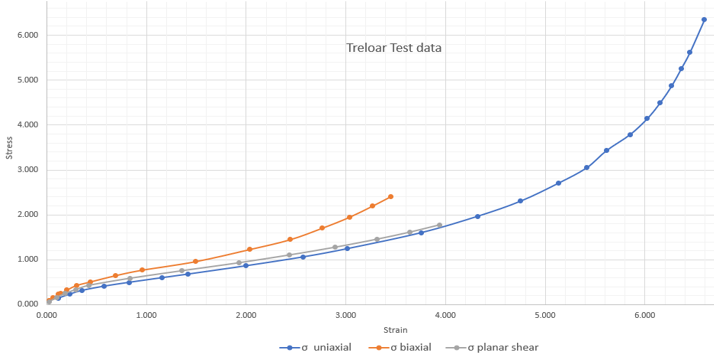
For RPOLY material model, 3 test data Uniaxial, Biaxial, and Planar Stress-Strain data were used, as they provided a good fit in OptiStruct. For Yeoh, Ogden, and ABOYCE material models, only Uniaxial test stress-strain data is used in the MATHE entry for curve fitting in OptiStruct (since only using uniaxial test data provided the best fit for these three material models). For all material models, the curve fit was better when the Poisson’s ratio of 0.4997 is used, instead of 0.495.
Results
OptiStruct outputs true stress and strains, which cannot be converted to engineering (nominal) stress-strain using the typical conversion equations since the equations are not valid at higher strains (above 200%).
Instead, the engineering stress-strain values are calculated by:
- True stress
- Engineering stress
- True strain
- Engineering strain
For engineering stress, combined SPC forces at nodes 3, 4, 5, and 6 are calculated at each increment and divided by the original area of the element face 3, 4, 5, 6 (100 sq. mm) to get the engineering stress. For engineering strain, the change in the length of the element along X-direction is calculated at each increment and divided by original length (10 mm) to get the engineering strain.
- Reduced Polynomial (RPOLY) ModelThe test data, OptiStruct curve fit and OptiStruct output data is:
Figure 4. Stress-Strain Plot for RPOLY Model 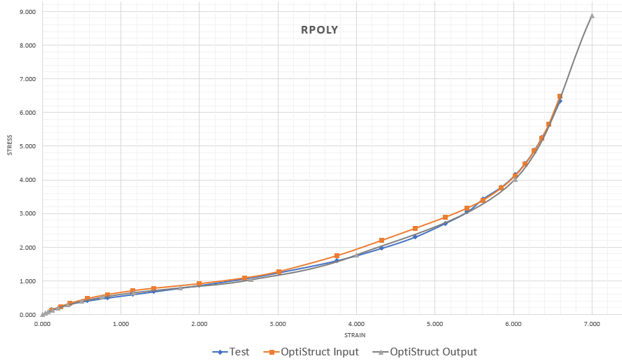
The RPOLY model correlates well with the test data, and the fit for the material model from test data is good.
- Ogden ModelThe test data, OptiStruct curve fit and OptiStruct results are plotted.
Figure 5. Stress-Strain Plot for Ogden Model 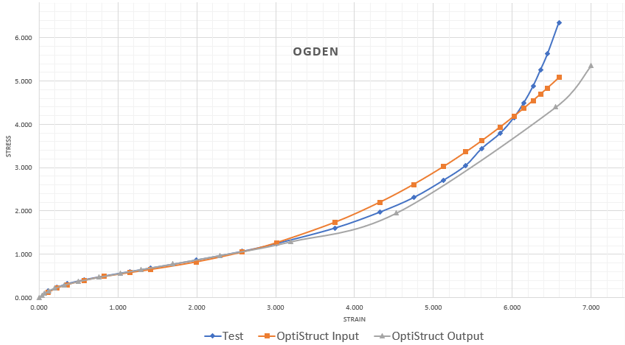
OptiStruct results and fit correlate well with test data until 300% strain, and continues to be reasonably close beyond 300%.
- Arruda-Boyce (ABOYCE) ModelThe test data, OptiStruct curve fit and OptiStruct results are plotted.
Figure 6. Stress-Strain Plot for ABOYCE Model 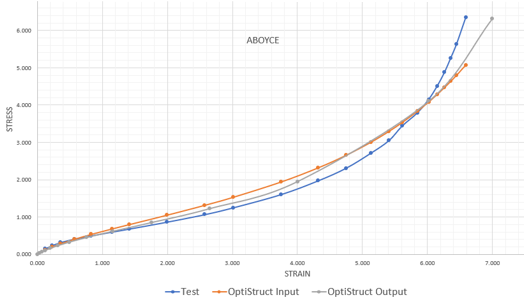
The ABOYCE model correlates very well with test results until 100% strain and continues to be a reasonably close match beyond 100%.
- Yeoh ModelThe test data, OptiStruct curve fit and OptiStruct results are plotted. Additionally, Radioss results are illustrated for Yeoh material model.
Figure 7. Stress-Strain Plot for Yeoh Model 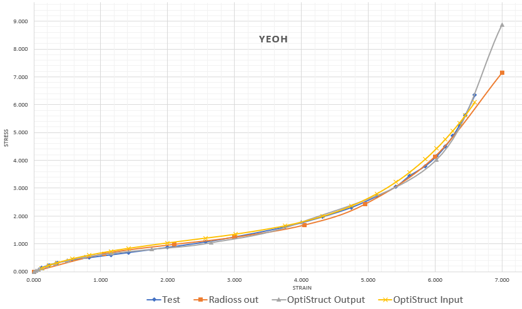
OptiStruct results correlate well with the test data and fit until about 525% strain and continues to be a reasonably good match beyond 525%. The results obtained by OptiStruct are in good agreement with both test result and Radioss output.
http://www.axelproducts.com/downloads/TestingForHyperelastic.pdf