The experimental validation was carried out in collaboration with Drive
System Design Ltd. (DSD). DSD performed a series of experiments taking a
single gear and rotating it in an oil sump, while varying the level of the oil and
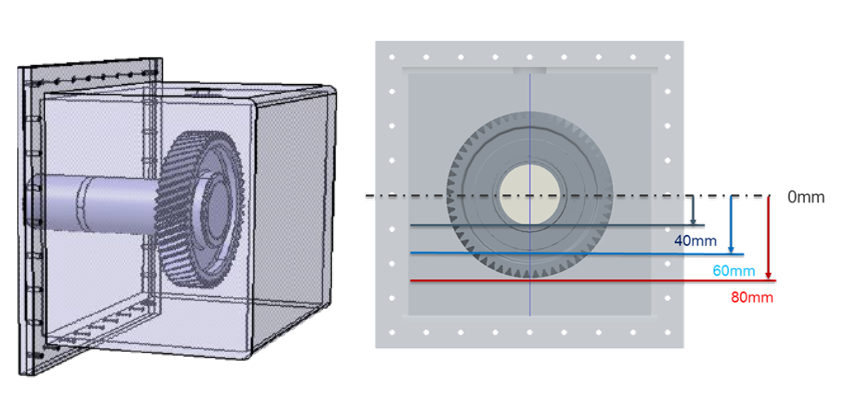
the RPMs. The sketch of the setup is shown in Figure 1 below.Figure 1. Experimental Test Rig Setup
The rotation speed is changed from 500 to 3000 RPM in increments of 500 RPM. The oil
level is varied from 40 to 80 mm, measuring from the axis of the gear.
Numerical Setup
The initial particle arrangement is obtained by directly discretizing the CAD model
provided by DSD without any simplification. This results in approximately 8.6
million particles (dx = 1e-3 m) for oil and air phases combined.
Results
Qualitatively nanoFluidX has shown very good agreement with the
experiments. Similar flow structures between the experiment and the simulation
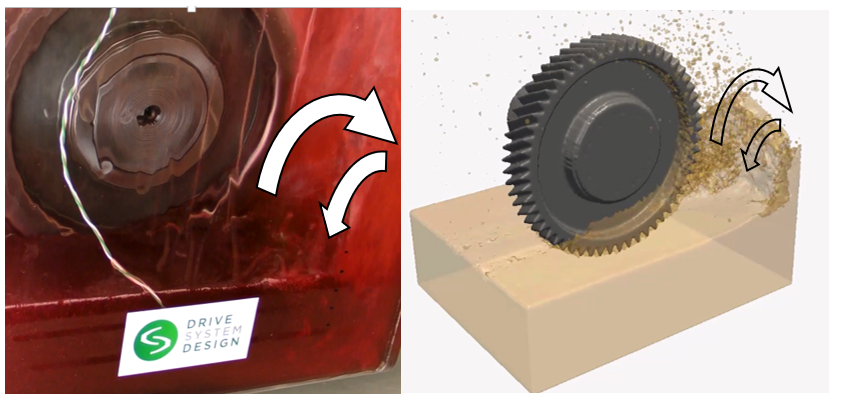
solution have been observed for every case.Figure 2. Example of the common flow structure. Observed in both simulations and experiments, noting that the relative
height of the oil column being raised is similar.
Most notable qualitative result is the observation of the windage effect in the 80 mm
oil level case. In the 80 mm case, the gear is not immersed in the oil sump, but
rather hovers over the oil surface with several mm distance. At 3000 RPM the windage
effects (motion of the air due to the gear rotation) become prominent and the oil’s
surface is disturbed in an oscillatory manner, causing occurrence of high frequency
waves. Furthermore, small amounts of oil are carried around the domain by the
windage effects, causing visible splashes. This behavior is very well captured by
the simulation. Instantaneous time frames can be seen in Figure 3 (experimental) and
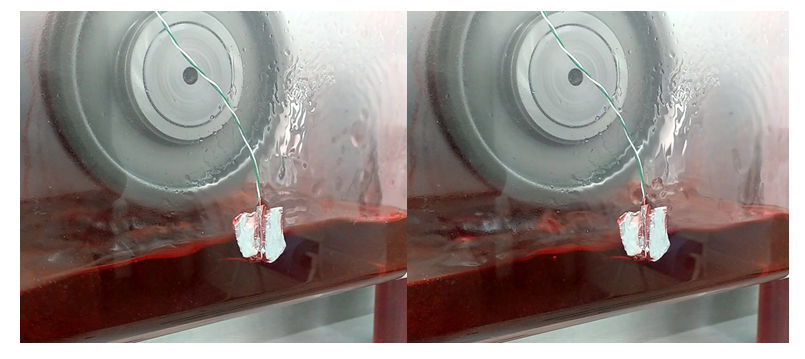
Figure 4 (nanoFluidX simulation).Figure 3. Experimental images of the 3000 RPM case at 80 mm oil
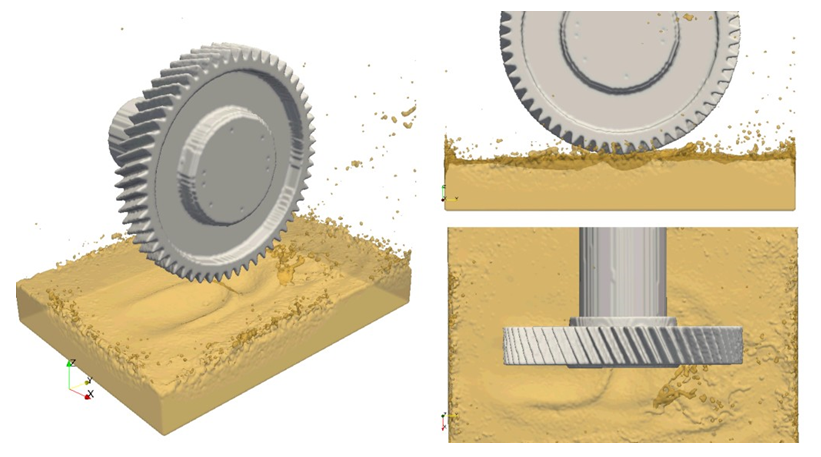
level . Showing disturbance of the oil surface due to windage effects. Figure 4. Instantaneous image of the nanoFluidX
simulation result for 3000 RPM and oil level of 80 mm. Clearly visible are the waves formed by the windage effects, asymmetry in
the wave formation (bottom right part of the image), as well as scattered
droplets carried by the air phase.