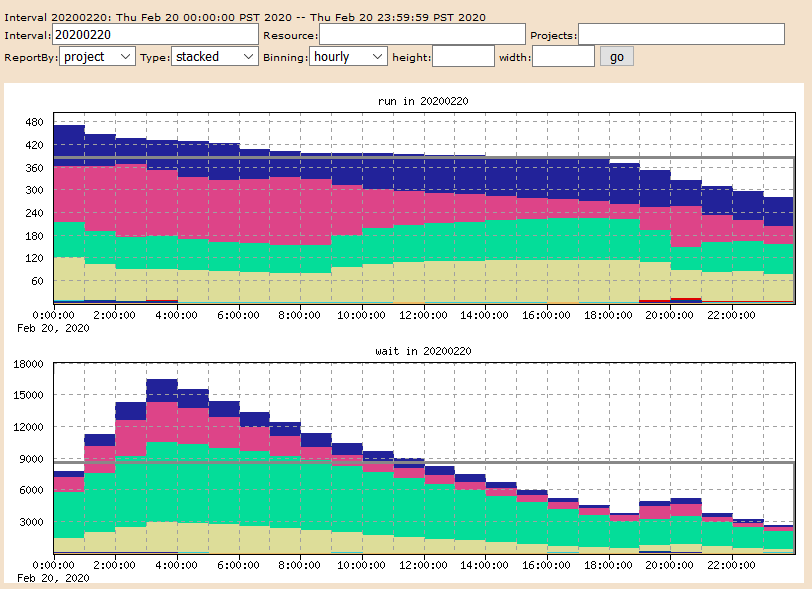
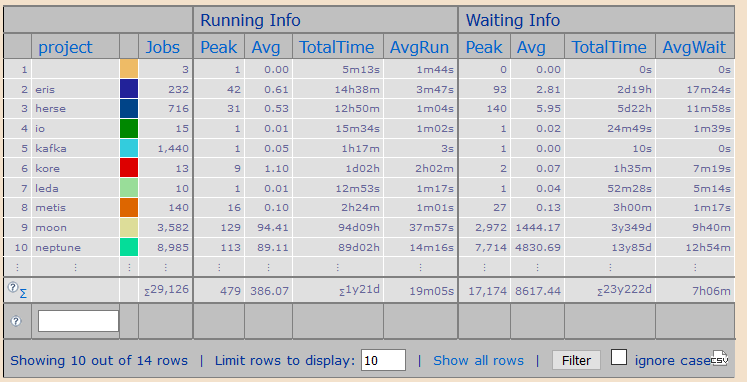
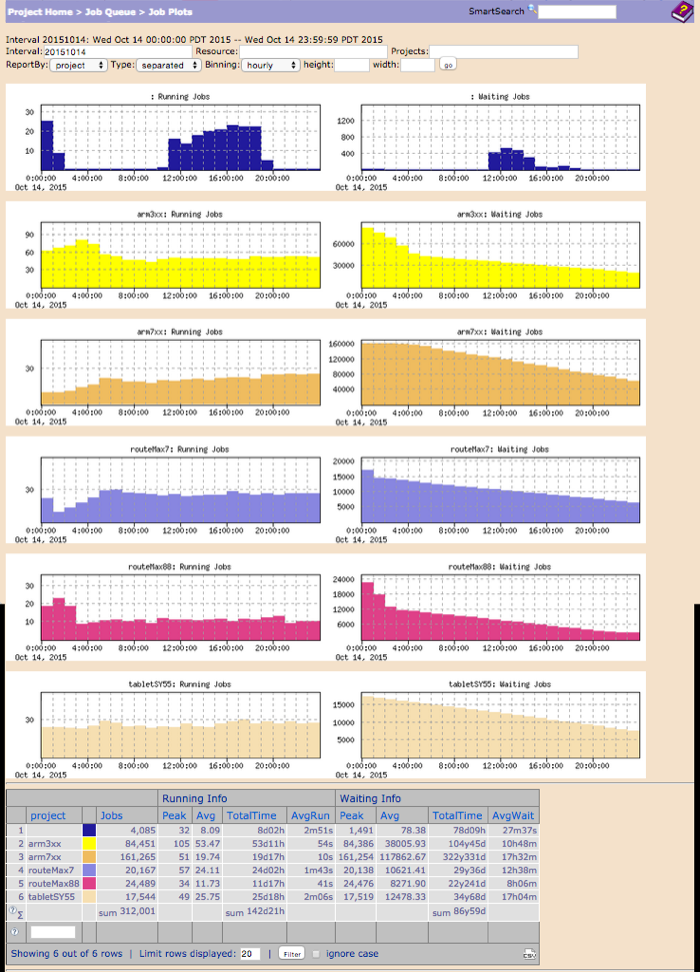
Information about the project jobs can be viewed through the browser on the Job Plots page.
There are two plots: one plot displays the number of jobs per project that are
running; the other plot displays the number of jobs per project that are waiting (in
queue). Each project is defined by color, which is listed in the table at the bottom
of the page. Other details, including the number of jobs per project that are
running and waiting, and specific details about the Running and Waiting information
are included in the table.
By default, all jobs projects are stacked: displayed together in a plot, with hourly
intervals (binning). The options of information to display:
Report by: User, host, jobclass or project. The
default setting is project.
Type: Stacked or separated. The default setting is separated.
Binning: None, minutely, hourly, daily, weekly, monthly. The default setting
is hourly.
To configure the view, select the desired item per drop menu and then press the
go button.
An example of the projects stacked is shown below:
Figure 1.
An example of the jobs separated is shown below: Figure 2.