Generate a Usage Report
License utilization report.
-
Go to the History tab and click on the
Usage drop down menu.

Figure 1. History PageFrom the Usage option, you can generate the following 11 types of web GUI reports:
- Daily Feature Statistics
- An overview of availability and utilization statistics for a time frame.
- Daily Feature Plots
- A graph of the metrics shown on the Feature Statistics page for a specific tag/feature combination.
- Efficiency Statistics
- A table showing the metrics associated with efficient license usage.
- Efficiency Histogram
- A graph that shows license availability. It can show both licensing bottlenecks and waste.
- Detailed Plots
- A group of graphs, which shows availability and utilization statistics.
- Heatmap
- A report, which shows a time period, represented as a 24x7 clock view.
- Checkout Statistics
- A report that can show pin-pointed data about license utilization.
- Checkout Details
- A report that shows the actual checkouts shown in the Statistics view.
- Duration Histogram
- A graph that shows the distribution of checkouts based on duration.
- Usage Comparison Plot
- A graph, which accompanies the checkout statistics page, and allows for complex report-by and filter options.
- Usage Trends
- A report on one or more features over a specified time frame.
-
In this example, you will generate a daily feature statistics report. To do so,
select Daily Feature Statistics from the drop-down list.
The first time you pull up a report, it will be blank.
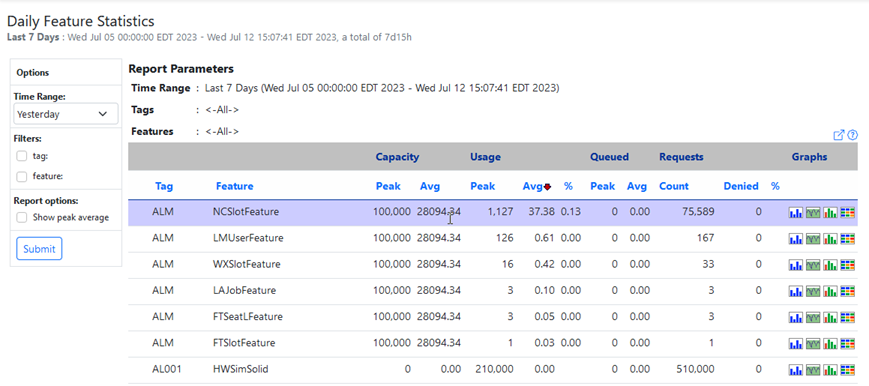
Figure 2. Daily Feature Statistics