HyperLife displays the following
result data available in the result file:
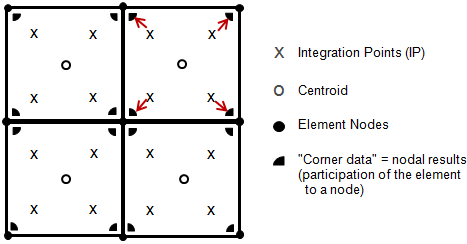
Centroid data - the centroid is the integration point or the available value that has
already been averaged by the solver (depending on the solver).
Integration points or Nodes (depending on the solver) - these results are "element
bound", meaning that each is the contribution of the specific element to that node;
therefore it is the corner data of that element.
Figure 1.
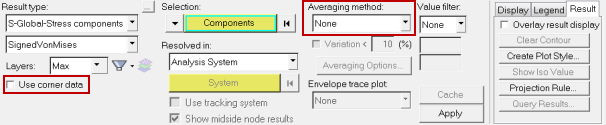
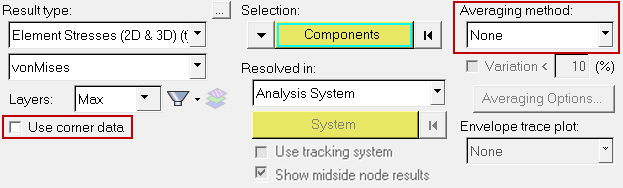
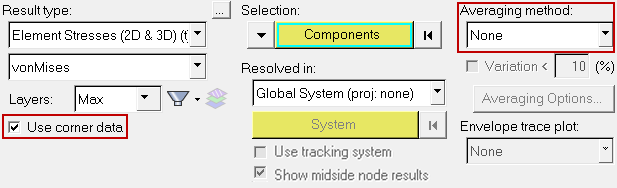
The Use corner data option in the Contour panel allows you to display color bands by
interpolating available corner results within each element. In addition, you can also use
the Averaging method drop-down menu to select the result coordinate system to be used to
contour the results.Figure 2.
Use corner data - controls if centroidal values or corner data is used for the
visualization of values at an element.
Averaging method - controls in which way this data (centroidal or corner data) is
visualized at the shared element nodes.
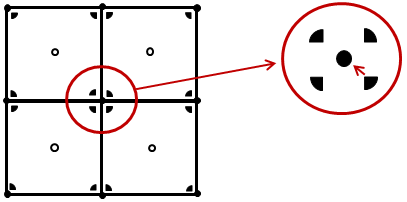
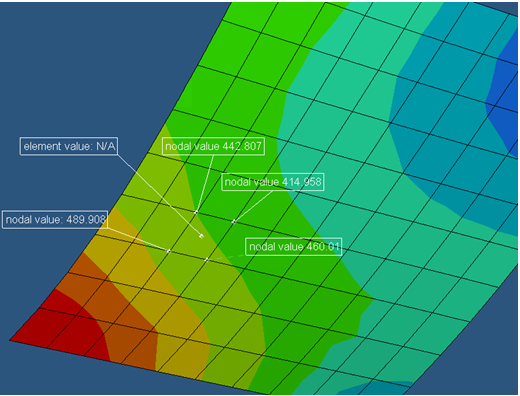
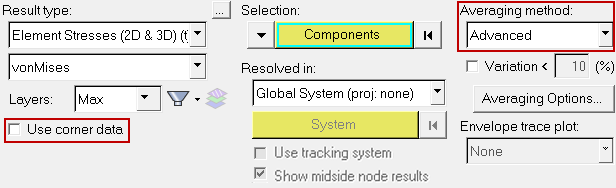
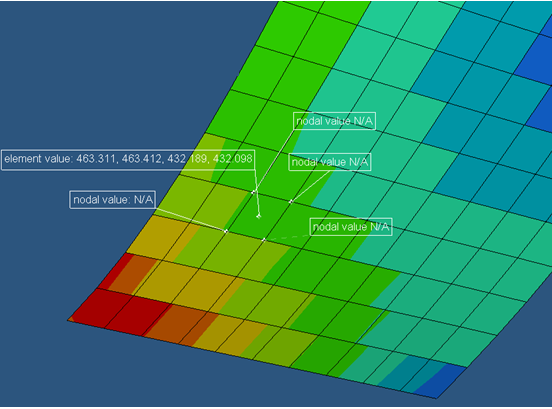
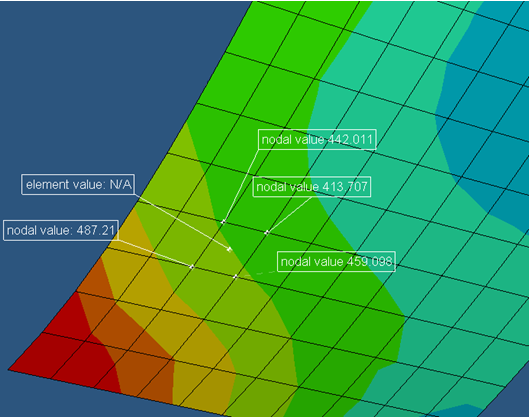
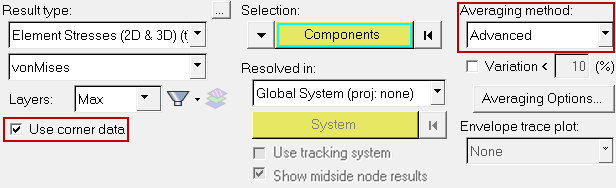
Figure 3.
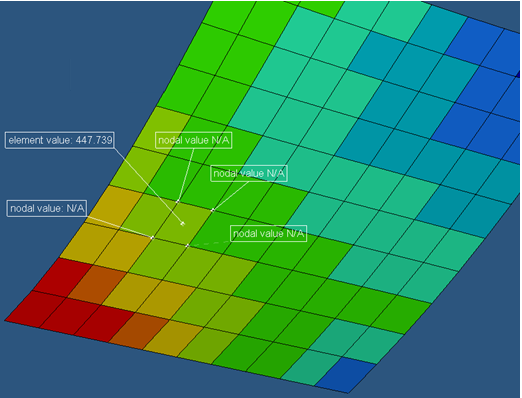
Examples of how the various corner data and averaging options are displayed in
HyperLife are displayed below.