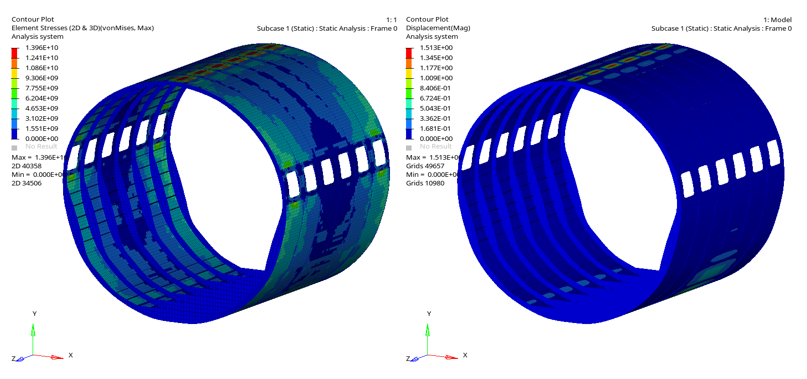
OptiStruct can be used to solve time-independent static
analysis. Figure 1 shows a fuselage section with SPC
boundary conditions on the bulkhead and a uniform pressure applied to the skin.Figure 1. Stress and Displacement Contours for Static Analysis of a
Fuselage Section
An analysis is termed nonlinear when the relationship between the Force
and Displacement is nonlinear. Most of the structural components in an aircraft
structure are subjected to large deformations, which are best analyzed through
nonlinear analysis. The main reasons for nonlinearity are:
Material nonlinearities
Geometric nonlinearities
Presence of nonlinear forces
Contact nonlinearities
Inertial Relief Analysis
Inertia relief analysis is mostly performed on unsupported structures to determine
the impact loads of structures or to calculate the distribution of forces. OptiStruct has two options for Inertia relief analysis.
PARAM, INREL, -1 is used when certain boundary conditions
are specified.
PARAM, INREL, -2 is used when no boundary conditions are
specified.
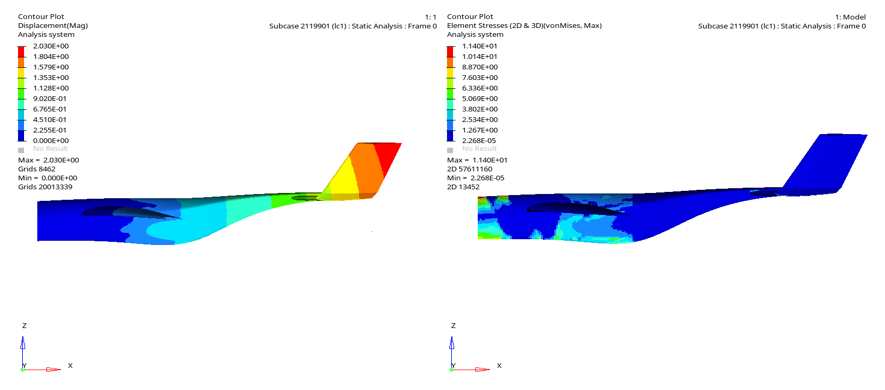
Figure 2. Displacement and Stress Contours for Inertia Relief
Analysis
Figure 2 shows the results from an Inertia Relief
Analysis performed on a fuselage model.
Normal Modes Analysis
Mode shapes provide the frequencies at which the structure will absorb all the
supplied energy when no load is acting on it. To analyze the displacement of a
structure at these frequencies, you can use Frequency Response Analysis. Normal
Modes Analysis of aircraft structures will help in determining:
Under constrained and loose components
The rotating speed which matches the natural frequencies in case of the
analysis of a blade or a rotor
The areas to be constrained or loaded.
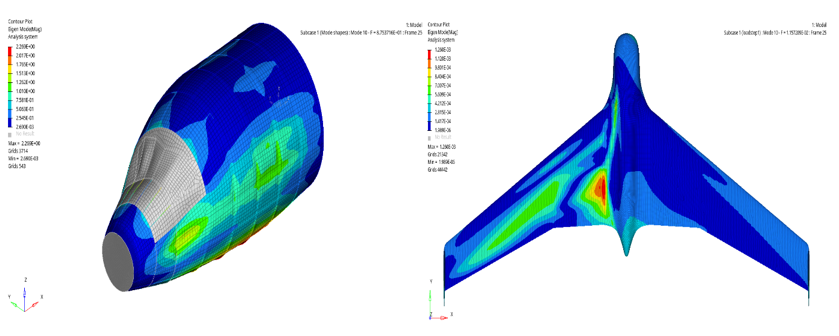
Figure 3. Normal Modes Analysis of a Fuselage and Drone
Figure 3 shows the results from the Normal
Modes Analysis for a fuselage and a drone. Both models have free-free boundary
conditions.
Frequency Response Analysis
Each frequency is solved independently and can also solve a several frequencies at a
time. This can be further used to determine the displacement versus frequency plots.
This helps to study the displacements of the structure when subjected to its natural
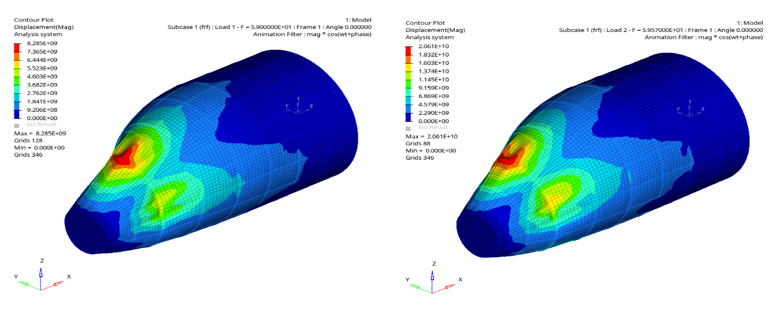
frequency calculated using Modal Analysis. The frequencies can be specified using
the FREQi card.Figure 4. Frequency Response Analysis of a Fuselage Section