
RD-V: 0210 Yeoh Hyperelastic Material
A one element model in tension and compression used as a test model and compare with analytical results.
The Yeoh model can be used to describe nearly impressible hyperelastic materials, like rubber. Set Yeoh parameter with /MAT/LAW94 and compare one element tension and compression Radioss results with analytical results.
Options and Keywords Used
/MAT/LAW94 (YEOH)
Input Files
Model Description

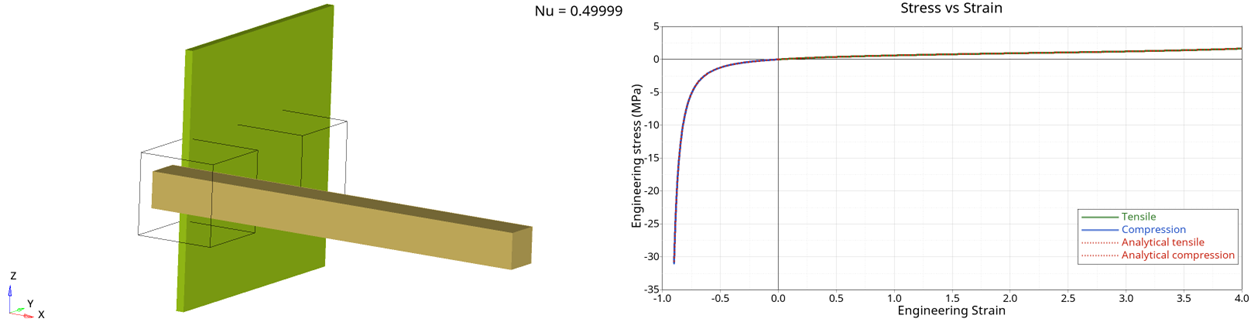
Units: mm, s, Mg, N, MPa
Properties: /PROP/TYPE14 (SOLID) with, Isolid=24, Ismstr=10, and Icpre=1
With the input Ismstr=1, Icpre=-1, Radioss will automatically determine the bast value according to the material and property used.
Simulation Iterations
- Yeoh theory:
The Yeoh energy density is:
This example assumes an incompressible ( ) hyperelastic material, then the strain energy density of Yeoh simplified, as:
With
Where,- Deviatoric stretch with and .
- The stretch in principal direction 1, 2, 3.
- Engineer strain in principal direction I.
It shows only three parameters need to be defined for the (incompressible) Yeoh model.
Uniaxial test is used in this example, then:
and
The Cauchy stress of Yeoh model is computed as:
In the uniaxial test, the Cauchy stress (true stress) in principal direction 1 is:
The engineer stress is:
In this example, three material parameters are defined below:Figure 3. Engineer stress-strain curve for Poisson ratio 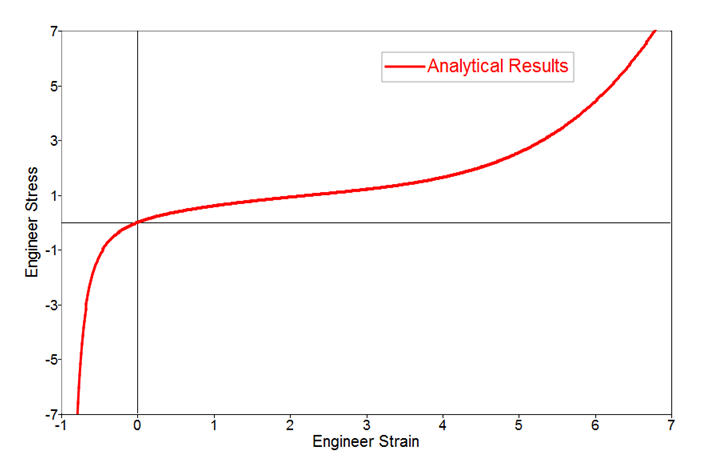
- /MAT/LAW94:
The hyperelastic model uses polynomial model and the Yeoh model is one of the polynomial models with only three parameters . In this example, viscous was not considered.
Results
In LAW94 Yeoh model, three parameters defined same as analytical case.
D1 needs to be defined in the material card. If D1 is not defined in LAW94, then the default Poisson’s ratio 0.495 is used.
Then, 1/D1=17.94 is printed in the Starter output file.
This can be checked as follows:
| Poisson's Ratio | D1 |
|---|---|
| (default value) | 17.94011589315 |
| (to be as close to analytical value with | 8999.928000576 |
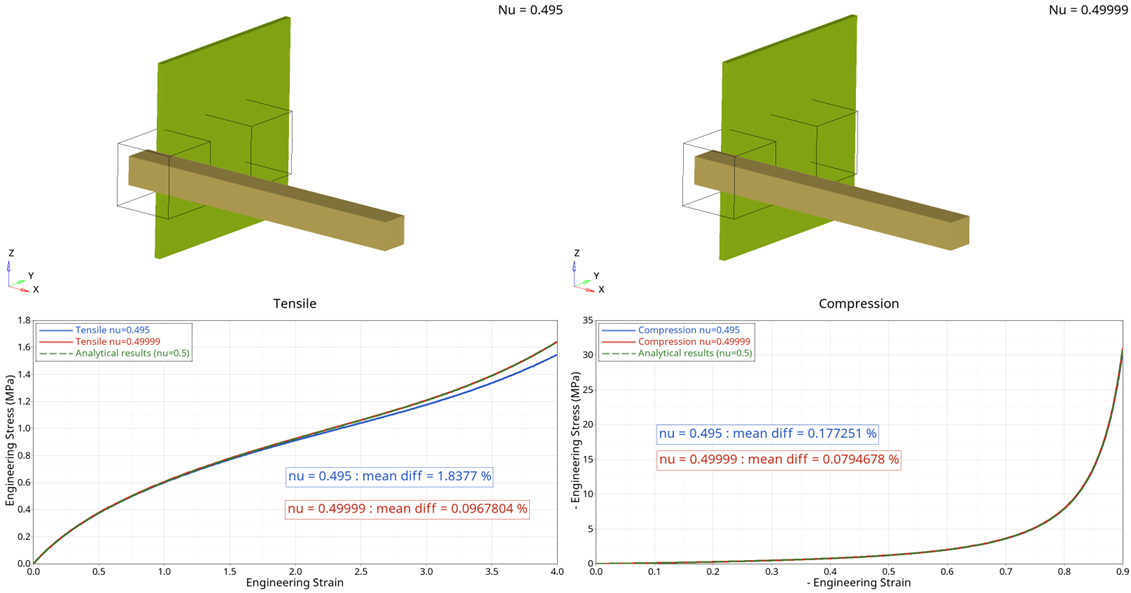
Both models return results very close to the analytical results.
The model with shows higher differences for the large tensile deformation (> 200%).
The time step and computation time is larger for the model with due to the larger bulk modulus. The results of this model are closer to the analytical results.