Order Analysis - Display
After loading a file, select a method to display and rank the orders.
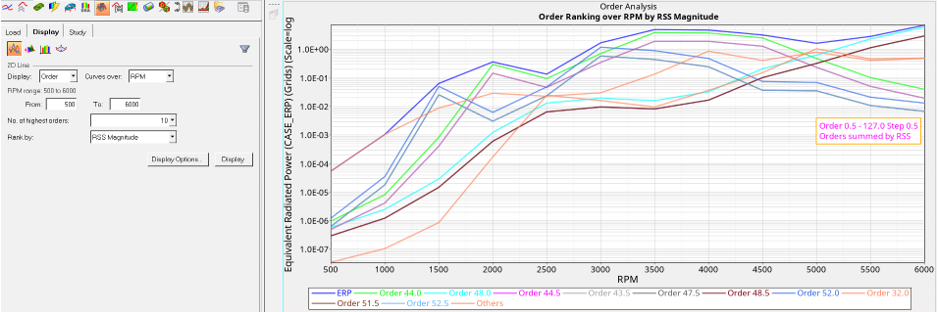
- 2D Line
-
- Display
- Select the type of curve to display.
- RPM range
- Select the RPM range that the order curves should be plotted within.
- No. of highest order
- After defining the RPM range, organize the display by selecting the number of highest orders.
- Rank by
- Define the method that is used to rank orders with one of
the following options:
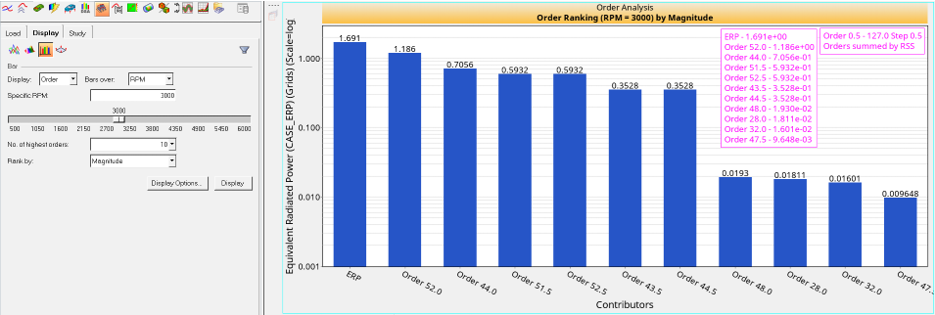
- Magnitude - Orders are ranked by the magnitude of the order. Available for Bar plot.
- RSS Magnitude - Orders are ranked by the root sum of squares of the magnitude of the order at selected frequencies. Available for 2D Line and 3D Surface plots.
- Display Options
- The Display Options dialog allows you to further customize the plot.
- Display
- Click Display to create and display the plot.
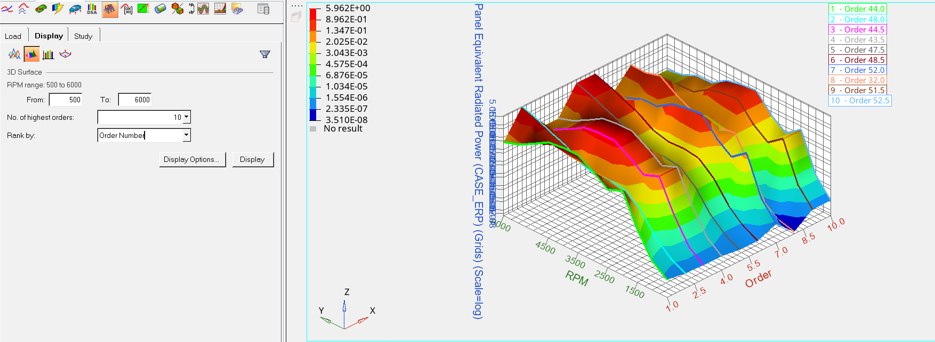
- 3D Surface
- Creates a 3D Surface plot of the response within an RPM range.
- Bar
- Creates a Bar plot of the response at a specific frequency or RPM.
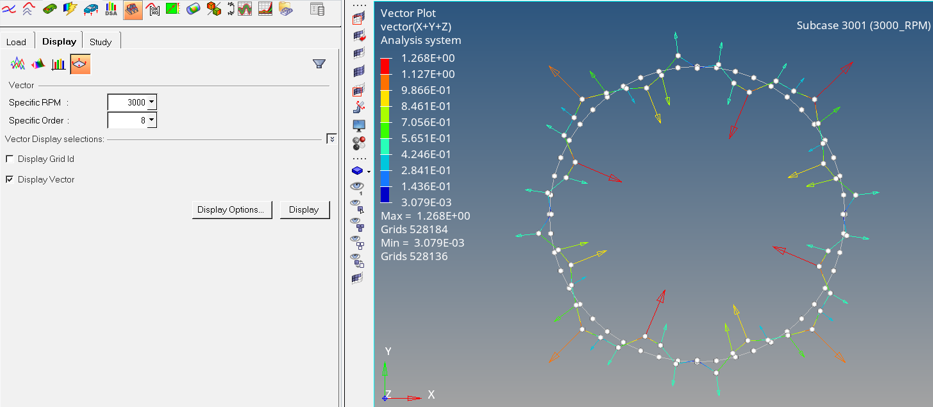
- Force Vector Animation
- Displays animation of force vectors.