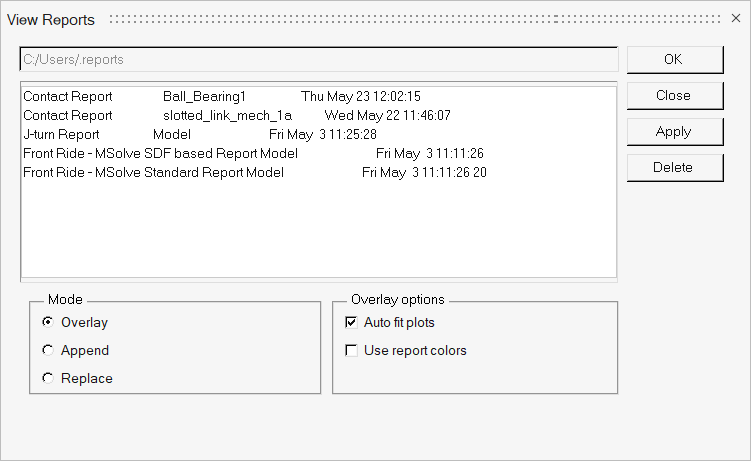
The View Reports dialog displays a report list of all reports generated from an
analysis task run.
Every analysis task in MotionView has an associated
report definition. The report definition describes the plots, text tables, and
animations that are created at the end of a run. Whenever a model is run, the name
of the report is placed in a report list. Report lists display the last 50 analysis
runs in reverse chronological order. You can access the report list by selecting
View Reports from the Analysis menu.Figure 1. View Reports Dialog
The options in the report list dialog allow you to overlay a report on top
of another or replace old reports with new ones.
Generating a standard report allows you to review the results of an
analysis. You can also examine results’ data using the plot window and the
animation window.
The reports log is in a file called .reports and its location is described
in the preferences.mvw file with the
*RegisterReportsLog() statement.
View a Report
From the Analyze ribbon, Results tool set, click the
Reports icon.
Select a report from the report list.
Under Model, select Append,
Overlay, or Replace.
Under Overlay options, select Auto fit plots or
Auto color plots, if desired.
Click Apply.
The report is appended, overlaid, or replaced.
If a report definition
already exists, a message is displayed with the following options:
Overwrite
Existing definitions are overwritten by new matching
definitions, one at a time.
Overwrite All
All existing definitions are overwritten by the new matching
definitions.