In this tutorial, you will learn how to create surface plots.
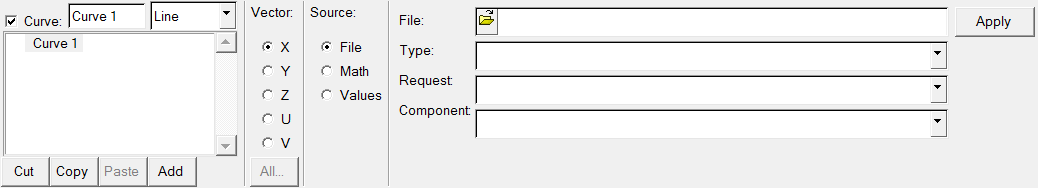
From the 3D Chart ribbon, click the Define tool.Figure 1.
The Define panel enables you to create new Surface plots. New data can be
mathematically defined using the program's curve calculator, or entered as
values.
Figure 2.
Create a Surface Plot from a Math Expression
From the menu bar, select File > Session > New.
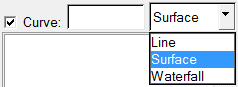
From the Define panel, select Surface from the drop-down
menu.
Figure 3.
Click Add under the Surface list.
A surface labeled Surface1 is added to the list.
In the text box rename Surface 1 to Math_Surface and
press Enter.
The new name is now displayed in the list and in the
legend.
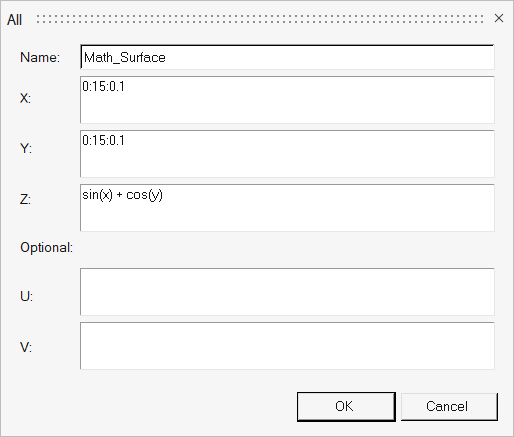
Verify that the Source type is set to Math.
Under Vector:, click All.
Set X to 0:15:0.1.
Set Y to 0:15:0.1.
Set Z to sin(x) + cos(y).
Figure 4.
Click OK to close the window.
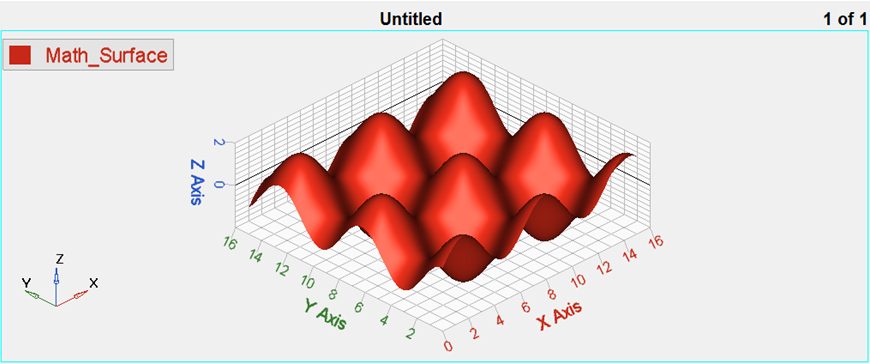
Click Apply to create the surface plot.
Figure 5.
Save the Session File
From the menu bar, select File > Session > Save As.