View Plot Results by Log X and Y
You can use the Log X and Log Y options to change the X and Y axis to logarithmic scale.
Note: You can also
select Log X and Y together to view the plot changes.
-
Click
 > Log X.
The plot view is displayed with the X axis logarithmic scale.
> Log X.
The plot view is displayed with the X axis logarithmic scale.Figure 1. A Plot View with Log X 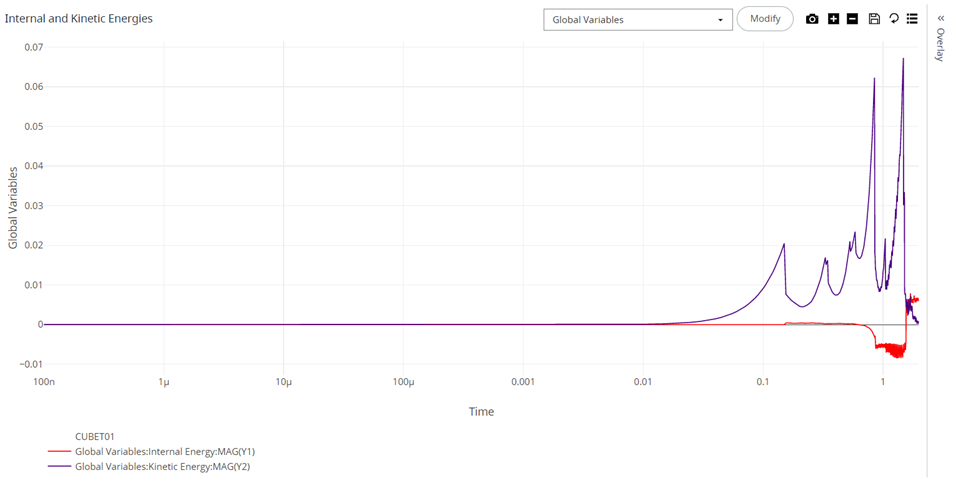
-
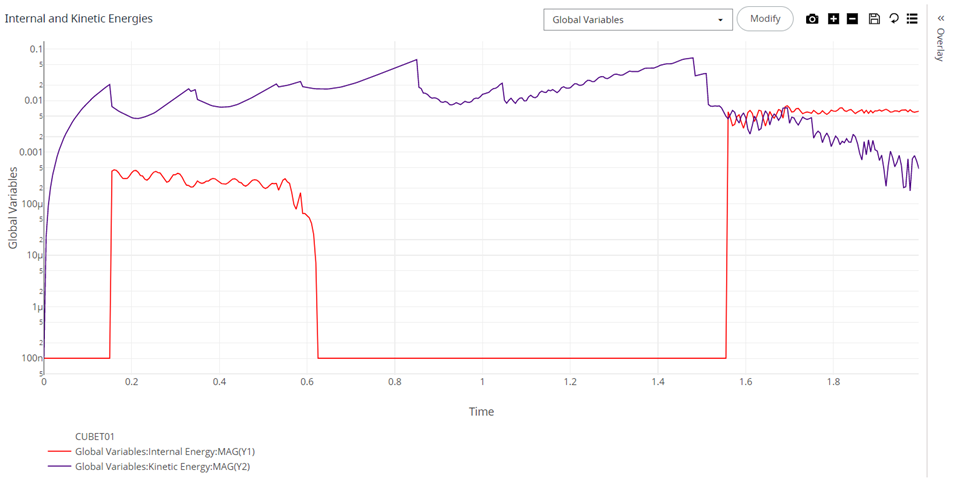
Click > Log Y.
The plot view is displayed with the Y axis logarithmic scale.
Figure 2. A Plot View with Log Y