Job Profiling
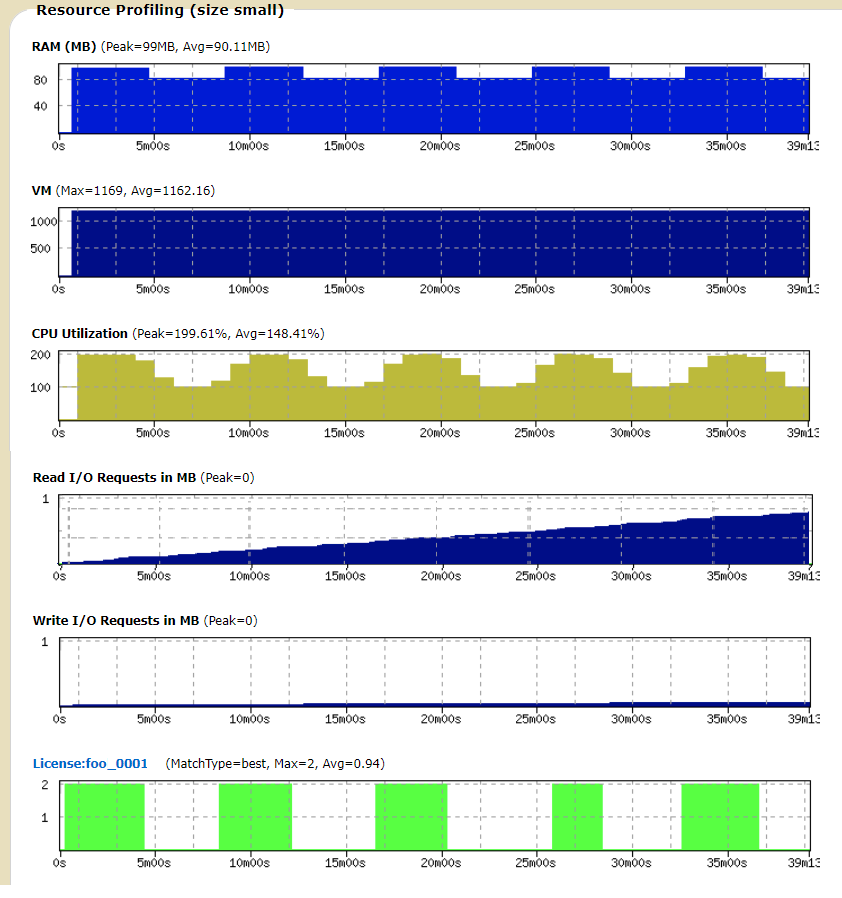
When job profiling is activated, Accelerator Plus tracks and plots performance statistics over the time the job is running.
- RAM usage
- VM size
- CPU utilization
- Cumulative Read I/O
- Cumulative Write I/O
- License checkouts (one plot per license)

Figure 1.
% wx run -profile myJobTo view a profile, use the browser interface and visit the specific page for the job.
# In a job class definition
set VOV_JOB_DESC(profile) 1# In the file $VOVDIR/local/vncrun.config.tcl
...
set VOV_JOB_DESC(profile) 1
...