The MPDB Tool automatically processes the Standard Deviation
on the barrier, based on the intrusion calculations. An automatic PPT report is generated with
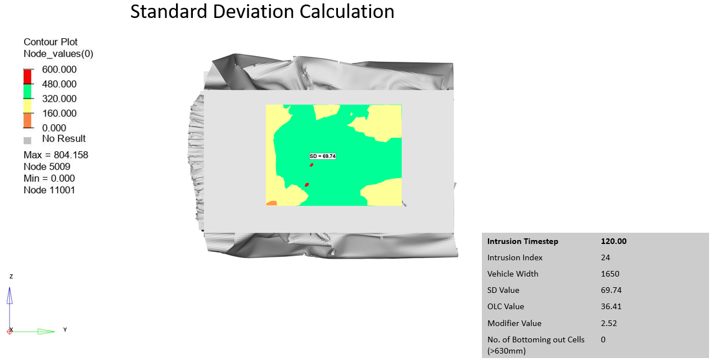
the following slides.Figure 1. Standard Deviation Calculation
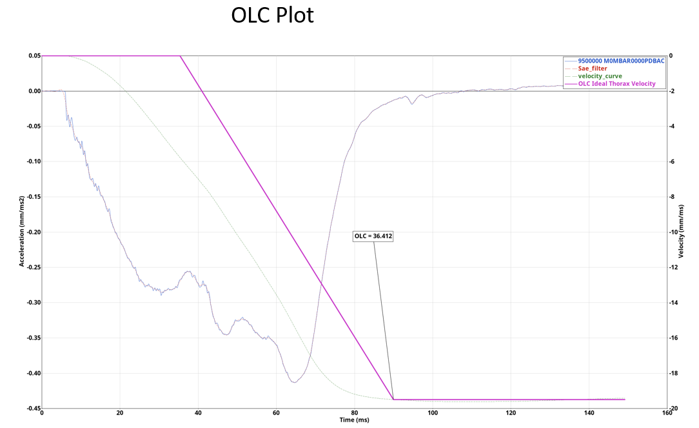
Occupant Loading Criterion Plot:Figure 2.
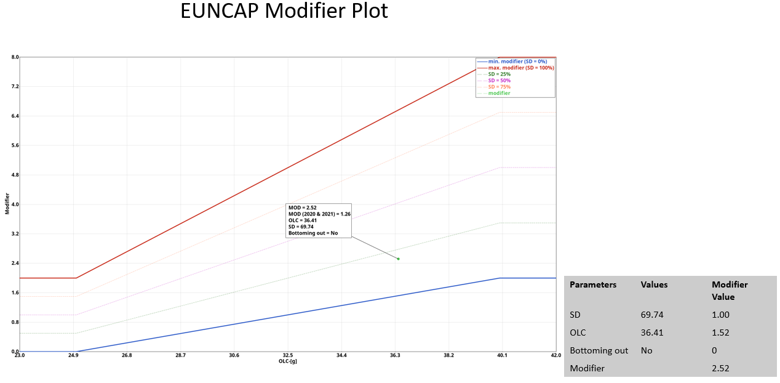
Modifier Plot:Figure 3.
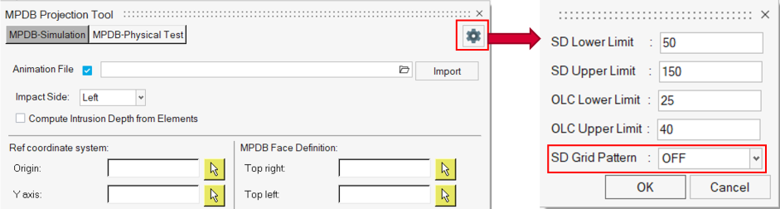
Additionally, you can request to display the barrier deformation (intrusion
contour) on the reference plate as a grid projection. A new option SD Grid
Pattern is included under the settings dialog in the MPDB GUI ( ). Figure 4.
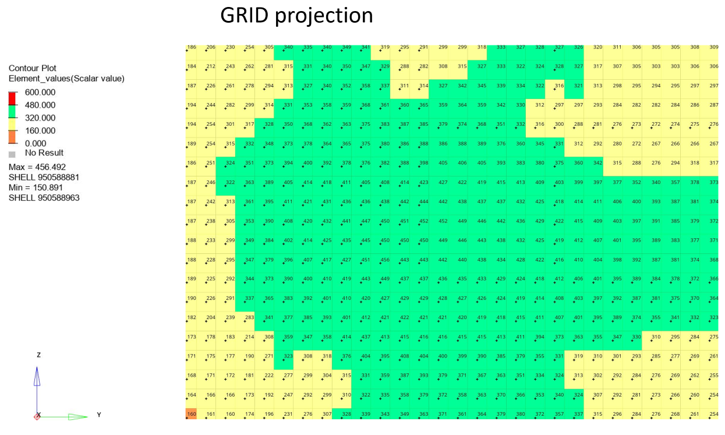
If the above option is turned ON, then a new slide is included in the final PPT
report as shown below.Figure 5.
Furthermore, in the “Output Directory” specified in the dialog, the following
files are exported automatically by the tool:
Output.key or output_0000.rad
Solver input file containing the deformed shape of the barrier at the selected time
step.
outputreference_plate.key or outputreference_0000.rad
Solver input file containing the reference plate defining the Grid for the
projection calculation.
export_barrier_reference.key or export_barrier_reference_0000.rad
Solver input file containing the deformed shape of the barrier at the selected time
step and the GRID used for the projection calculation.
outputprojection.hwascii
ASCII results file containing the nodal or elemental projection values along with
their entity IDs.
MPDB_session_file.mvw
Session file with results.
Bottoming_Out_Data.csv
Text file containing bottoming out data (if a bottoming out scenario is found) -
node IDs and their corresponding projection values within a 40mm x 40mm area.
*.pptx
Automatic PPT report generated by MPDB tool containing Standard deviation, OLC and
modifier plots.
 ).
).