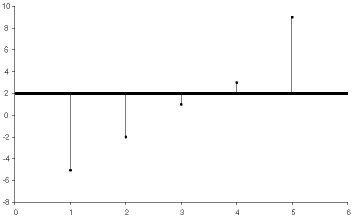
A plot of the last example is shown below:Figure 1.
The horizontal line represents the average of the values in the vector. The vertical
lines represent the differences between the values of the vector and the average of
the values.
Comments
The average deviation is the average difference between the vector elements and the
average of the vector elements. The sign of each element is not taken into
consideration when calculating the deviation. The sign of each element is taken into
consideration when calculating the average of the elements.