FBD Bar Plot
Display forces and moments acting on beam and bar elements.
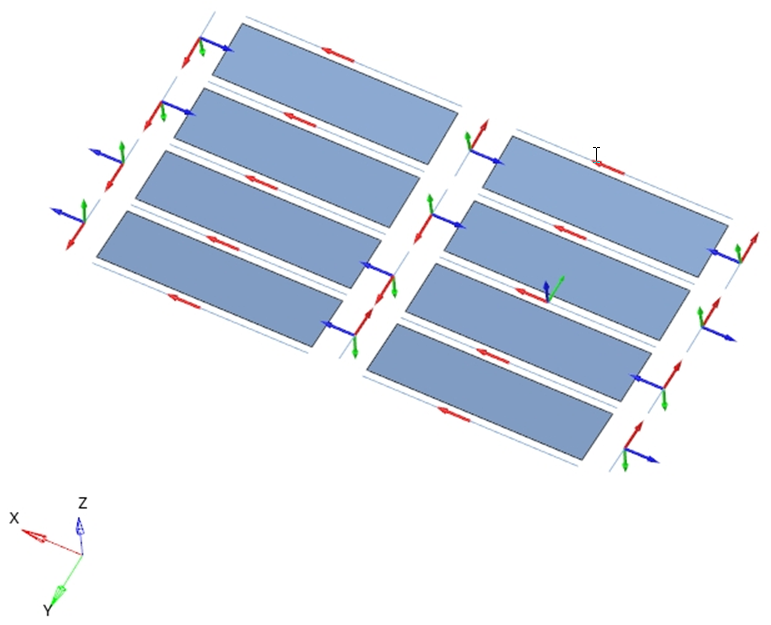
From the Post ribbon, click the Bar Plot
tool.Figure 1.

Restriction: Only available in the Nastran and OptiStruct
solvers .
The tool contains the following:
- Free Body Sections
- Define one or more free-body sections.
- Properties
- Shows all properties of a selected free-body section.
- loadcases
- List of subcases available inside all of the imported result files.
- FBD Plot and Display
- Visualization options.
The workflow is:
- Create a free-body section.
- Set the properties of the selected free-body section.
- Select a loadcase.
- Set the options for the bar plot.
- Display the bar plot for the selected loadcase.
Create Free-Body Sections
Right-click and select Create.
A new free-body section is created.
Set Properties of the Selected Free-Body Section
Select a free-body section.
The properties display.
- Name
- The name of the free-body section.
- ID
- The ID of the free-body section.
- Color
- The color of the free-body section.
- Entity List
- Select bar and beam elements for the free-body section.
Select a Loadcase
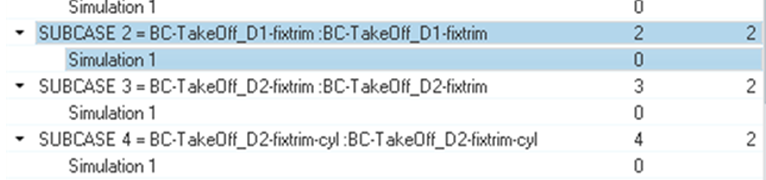
Select a loadcase for the bar plot.
Figure 2.
Bar Plot Visualization Options
Define visualization options for the bar plot.
- Bar Plot
- Select if the bar plot will show on nodes or elements. Select forces and moments that will display.
- Force/Moment Diagram
- Select forces and moments that will display. Select the plot direction.
- Create Envelope
- Activate the checkbox to create an envelope using multiple loadcases.
- Show values
- Activate the checkbox to display values.
- Size Scaling
- Defines how bar plot vectors will be scaled for visualization.
- Arrow Length (%)
- Scales bar plot vectors for visualization.
- Color
- Change the color of forces and moments.
- Vector heads
- Defines if the bar plot vector points to a point or out of it.
- Vector styles
- Change the style of bar plot vectors.
- Numeric format
- Defines the numeric format of the values shown.
- Tables
- Creates tables with forces and moments for one or multiple free-body sections and for one or multiple loadcases.
- The summary table shows all forces and moments for multiple free-body
sections.
Figure 3. 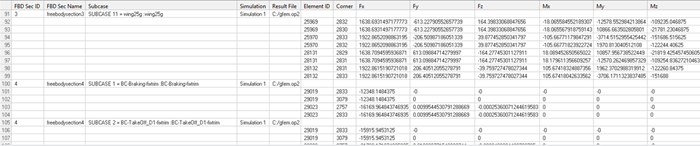
- The min/max table shows minimum and maximum values for forces and
moments.
Figure 4. 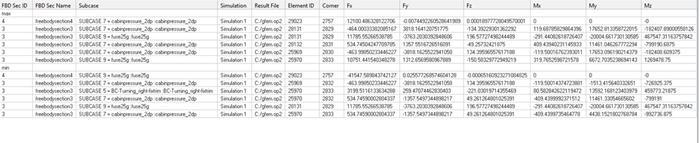
Display the Bar Plot for the Selected Loadcase
- Click Apply to show the bar plot.
- Click Clear to hide the bar plot.