In the modeling window, drag and drop the
bullet_local.op2 file.
The model and results files are loaded.
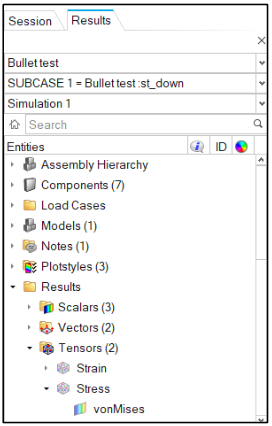
Use the Results Browser to review the available subcases
and verify that SUBCASE 1 is selected.
Create Contour Plots
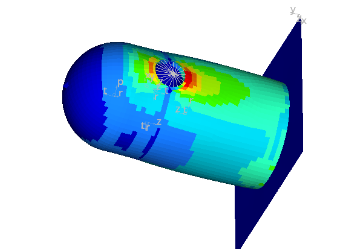
In the Results Browser, expand Results > Tensors > Stress. Select the vonMises icon to show the
vonMises contour.
Figure 2. Figure 3.
From the Results ribbon, click the Contour tool.
Figure 4.
On the panel, notice that the Result type is set to
vonMises Stress. Set the Averaging method to
Simple. Click Apply.
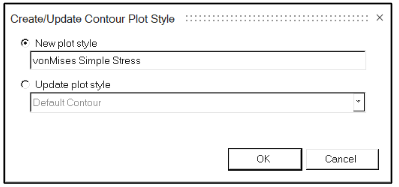
Select Create Plot Style and define the New plot style
name as vonMises Simple Stress. Click
OK.
Figure 5.
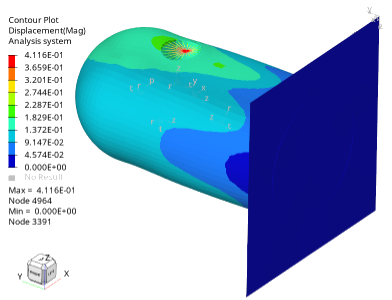
In the Results Browser, expand the Plot Styles folder and
select the icon next to Default Contour.
Notice how the contour changed to a contour of displacements.
Figure 6.
Click the icon next to vonMises Simple Stress.
Create a Tensor Plot
In the Results Browser, expand the Tensor folder (Results > Tensors > Stress).
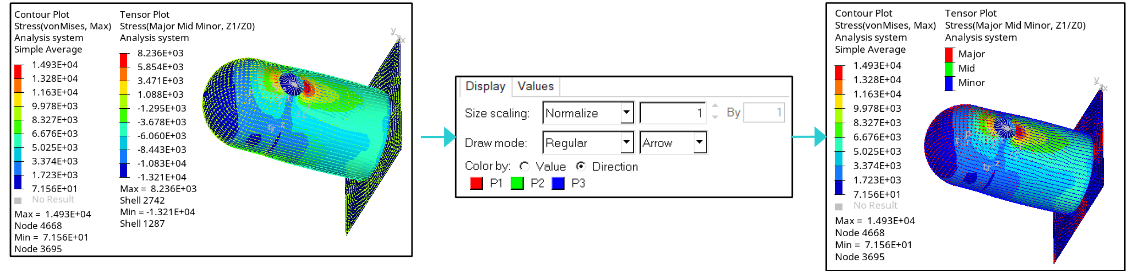
From the Results ribbon, click the Tensor tool.
Figure 7.
From the panel, select Color by: Direction and review
the model.
Figure 8.
Clear the tensor plot.
Close the panel.
Right-click and choose Select > All to select the components in the modeling window.
Right-click and select Clear Plot > Tensor
Investigate the Stress Results
From the Results ribbon, click the Query tool.
Figure 9.
Verify that Node ID, Node
Coordinates, and Contour (Stress) are
selected in the panel.
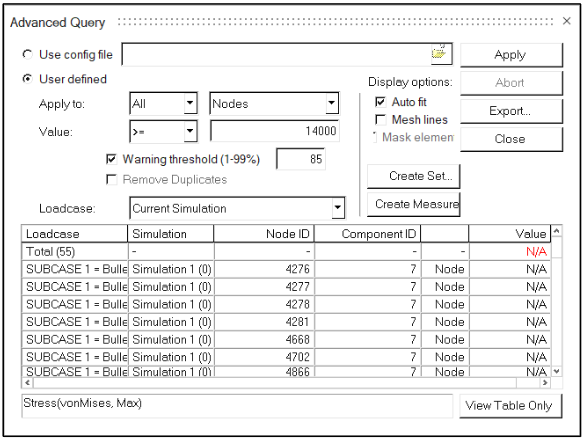
Select a few nodes in the model and open Advanced
Query.
After setting the following options, click Apply.
Apply to: All, Nodes
Value: >=, 14000
Warning threshold (1-99%): 85
Figure 10.
Change the Warning threshold to 95 and observe that less
nodes are reported in the table.
Close the table and make all the
components visible.
Create a Linear Superposition Derived Loadcase
From the Results Browser, expand the Load
Cases folder. Select all the Simulation 1 load cases,
right-click, and select Create > Derived Load Case > Linear-Superposition.
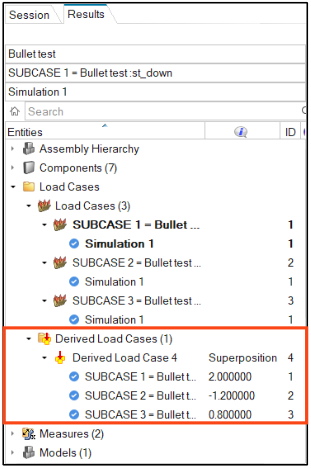
Expand the Load Cases folder again. Under
Derived Load Case, set the
Superposition of the subcases as follows:
Subcase 1 → 2.0
Subcase 2 → -1.2
Subcase 3 → 0.8
Set the Derived Load Case 4 as Current. Derived Load Case 4 > right-click > Make Current.
Figure 11.
After reviewing the model, set Subcase 1 as Current. SUBCASE 1 > right click > Make Current.
Figure 12.
Create Local Hotspots
From the Results ribbon, click the
Hotspot tool.
Figure 13.
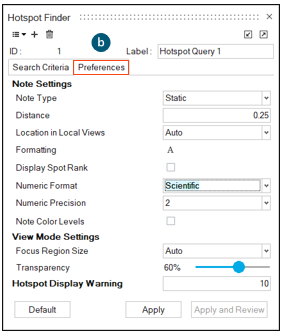
From the Hotspot guide bar, select > Preferences tab and check the following options:
Note type: Static
Numeric Format: Scientific
Transparency: 60%
Figure 14.
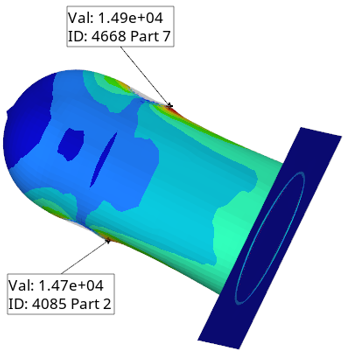
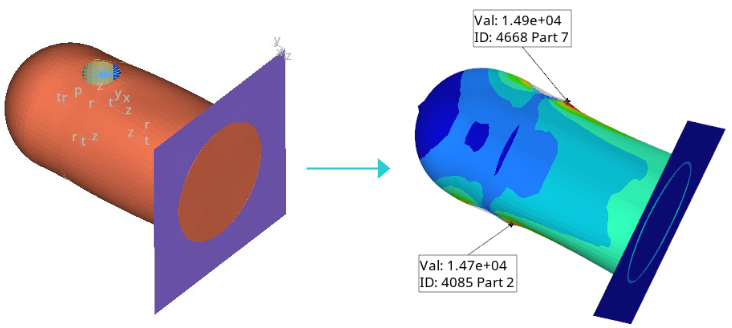
Apply the preferences options and search the Hotspots by
clicking on the guide bar.
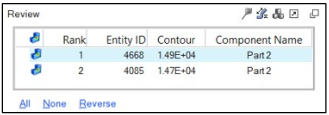
In the review table, click to review the node in the modeling window.
Figure 15.
Figure 16.
Create a Measure Group
From the Results ribbon, click the
Contour tool.
Figure 17.
Notice that Result Type is set to vonMises
Stress.
Set the Averaging method to None. Click
Apply.
From the Home group, click the
Measure tool.
Figure 18.
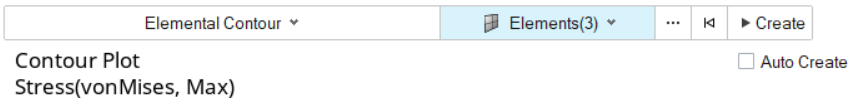
On the guide bar, set the Elemental
Contour as the Measure type.
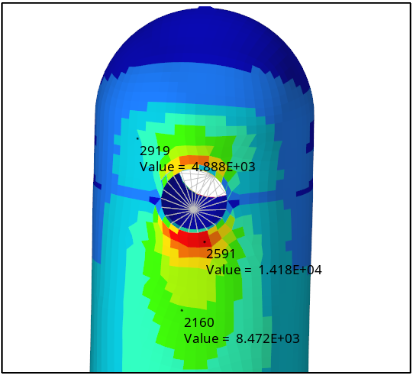
Select three different elements, then click
Create.
If Auto Create is selected, there is no need to click
Create.Figure 19.
Review the model and the measures created.
Figure 20.
Create Notes at Local Hotspots
From the Results ribbon, click the
Contour tool.
Figure 21.
Notice that the Result Type is set to vonMises
Stress.
Set the Averaging method to Simple. Click
Apply.
From the Results, click the Notes
tool.
From the guide bar, click
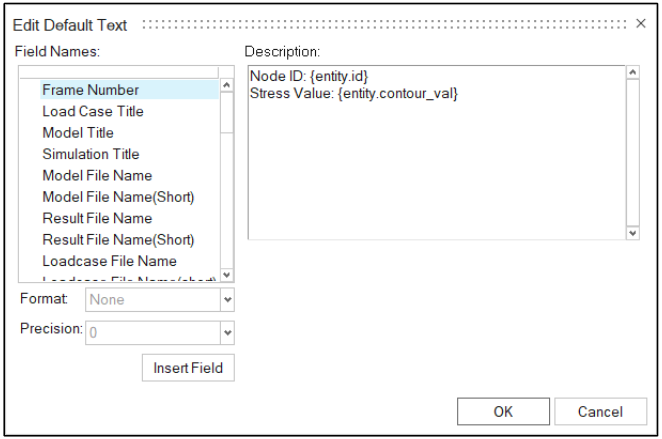
Preferences, . Click the A next to Text.
The Edit Default Text dialog opens.
In the Description Field, delete what is currently there and add
Node ID:.
Under the Field Names, select Entity ID and click
Insert Field.
Press Enter within the Description field to start a new
line and then add Stress Value:.
Under Field Names, select Entity contour value and click
Insert Field.
Figure 22.
Click OK.
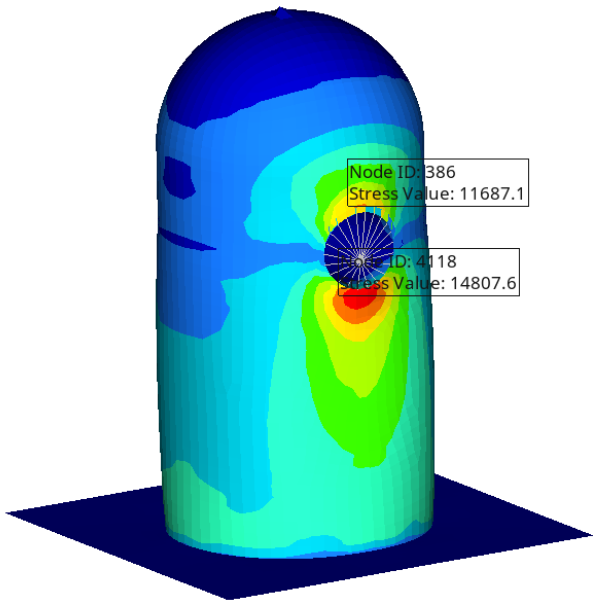
With the selector set to Nodes, select a node below the
hole and another above the hole.


 > Preferences tab and check the following options:
 on the guide bar.
 to review the node in the modeling window.