Tasker Load Reports
vovtasker continuously logs 1 minute, 5 minute and 10 minute load averages of the machine where the tasker is running. Tasker load reports are available on the Tasker Load page.
Set Up Aggregation
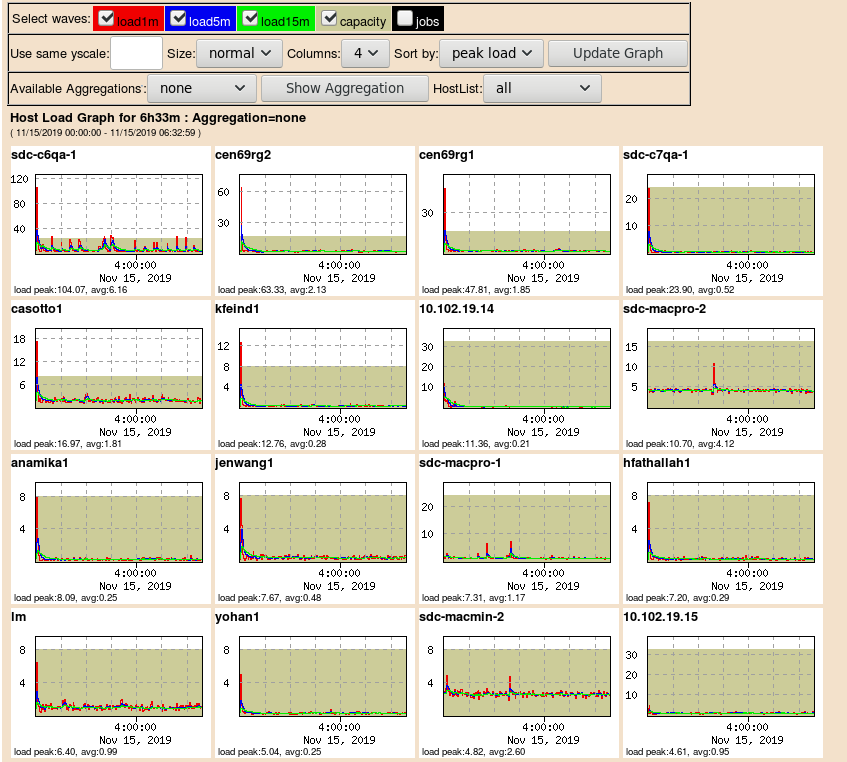
Figure 1.
In addition to plots of individual taskers, plots can be aggregated to show the sum of the data of a selected group of machines (taskers). For example, the loads of the Linux machines could be aggregated and then compared to the summation of the loads of the HPUX machines. This optional feature can be set up in the taskerload configuration file.
For the Tasker Load page, the taskerload configuration file is located at: projName.swd/taskerload_config.tcl
For Accelerator with the queue name vnc, the
taskerload configuration file is located at:
$VOVDIR/../../vnc/vnc.swd/taskerload_config.tcl
Ownership, Type and Speed.
# Sample of taskerload_config.tcl
set TASKERLOAD(aggregateby,Ownership)   "Development Regression Marketing"
set TASKERLOAD(aggregateby,Type)        "Linux"
set TASKERLOAD(aggregateby,Speed)       "Fast Slow"

set TASKERLOAD(taskers,Linux)   "farm01 farm02 farm03 farm04 farm05"

set TASKERLOAD(taskers,Fast)  "farm01 farm02 farm04 farm07 farm08"
set TASKERLOAD(taskers,Slow)  "farm12 farm13 farm14"

set TASKERLOAD(taskers,Development) "farm01 farm02 farm07 farm08 farm09"
set TASKERLOAD(taskers,Regression)  "farm03 farm04 farm05 farm 06 farm10 farm11 farm13"
set TASKERLOAD(taskers,Marketing)   "farm12 farm14"
Setting up Aggregation by Speed
Two categories of Speed are available: Fast and
Slow. The Fast category includes machine
farm01, farm02 farm04 farm07 and farm08. The Slow category includes
machine farm12, farm13 and farm14. In this case, choosing to have the report
aggregated by Speed will result in two plots: one plot with the sum
of the load of the machines defined in Fast category; one plot with
the sum of the loads of the Slow machines.
Speed: 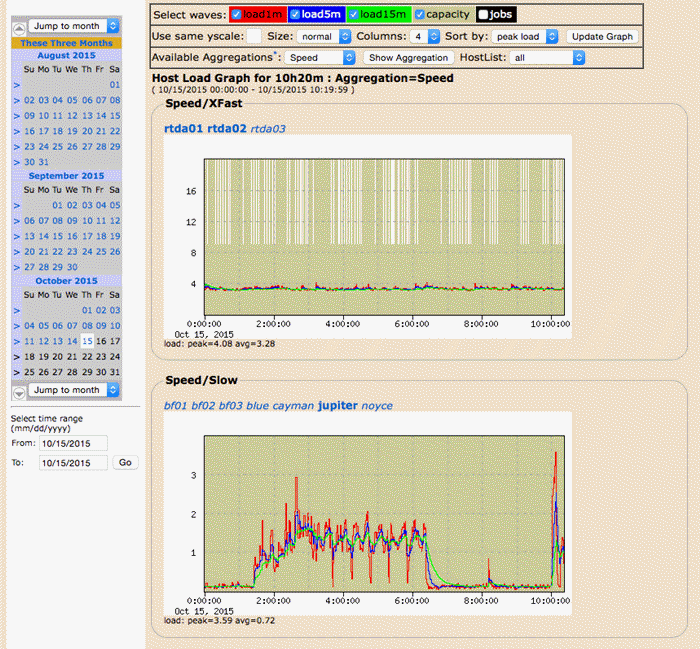
Figure 2.